Using Skew-Ts to Assess Icing and Wind Shear Jonathan Guseman Joe Jurečka National Weather Service Lubbock, TX What Is a Skew-T? Formally referred to as a Skew-T Log-P thermodynamic diagram Uses temperature and pressure as coordinates
"Using Skew-Ts to Assess Icing and Wind Shear" is the property of its rightful owner. Permission is granted to
download and print the materials on this website for personal, non-commercial use only, and to display it
on your personal computer provided you do not modify the materials and that you retain all copyright
notices contained in the materials. By downloading content from our website, you accept the terms of this
agreement.
Presentation Transcript
01
Using Skew-Ts to Assess Icing and Wind Shear Jonathan Guseman & Joe Jurečka
National Weather Service
Lubbock, TX<br>
02
What Is a Skew-T? Formally referred to as a Skew-T Log-P thermodynamic diagram
Uses temperature and pressure as coordinates
Properties of air parcels can be evaluated and forecasted based on this vertical snapshot of the atmosphere at a specified point
Time spent learning this tool will open up a world of insight to improve your flight experience<br>
03
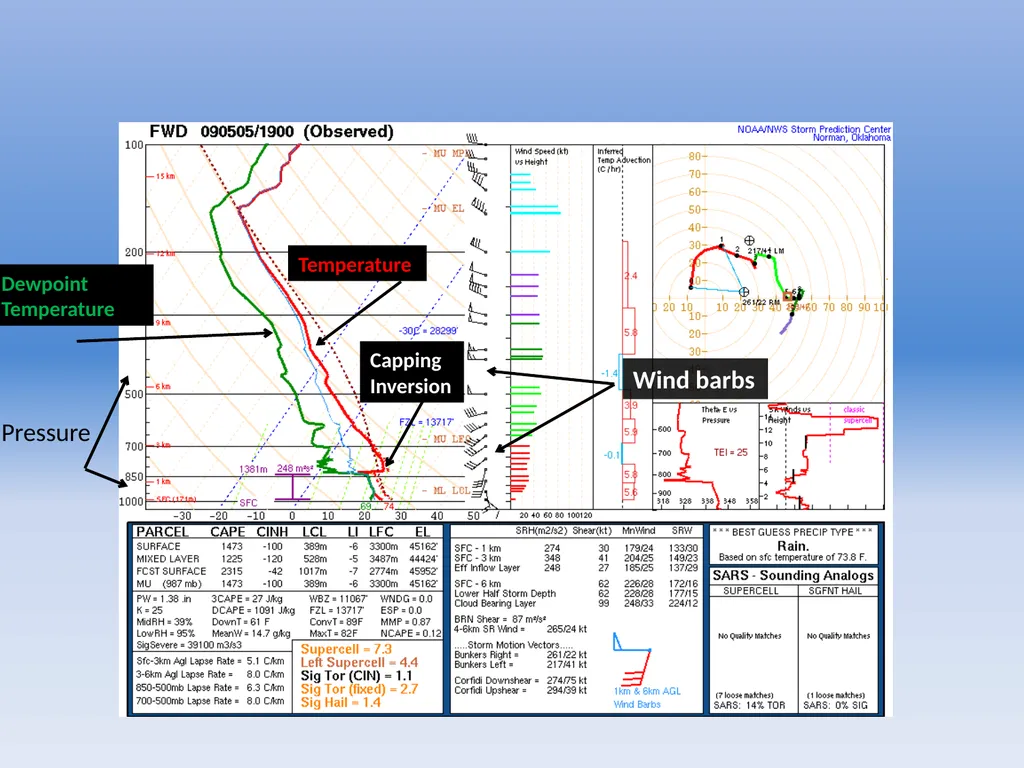
Dewpoint
Temperature Temperature Wind barbs Pressure Capping Inversion<br>
Why Use Skew-Ts for Aviation Purposes? Balloon soundings are the most comprehensive means to ascertain what’s really going on in the atmosphere
Vertical snapshot of atmosphere acquired twice a day
Viewing of all possible flight levels allows determination of aircraft hazards
Icing and wind shear are two of the most dangerous threats which are both easily identifiable
What can Skew-Ts do for you?
See where air is smooth (avoid near-surface thermal turbulence and turbulence produced by wind shear)
Save money by changing flight levels (wind optimization)
Increase situational awareness for icing<br>
06
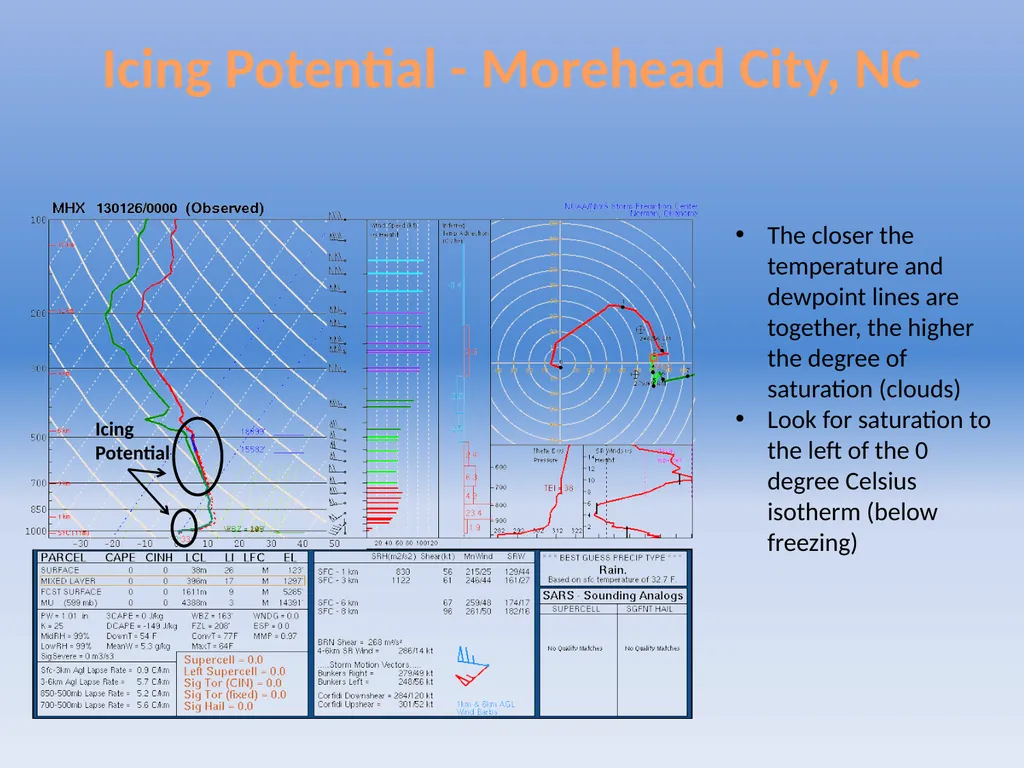
Icing Potential Icing Potential - Morehead City, NC The closer the temperature and dewpoint lines are together, the higher the degree of saturation (clouds)
Look for saturation to the left of the 0 degree Celsius isotherm (below freezing)<br>
07
Directional Wind Shear –
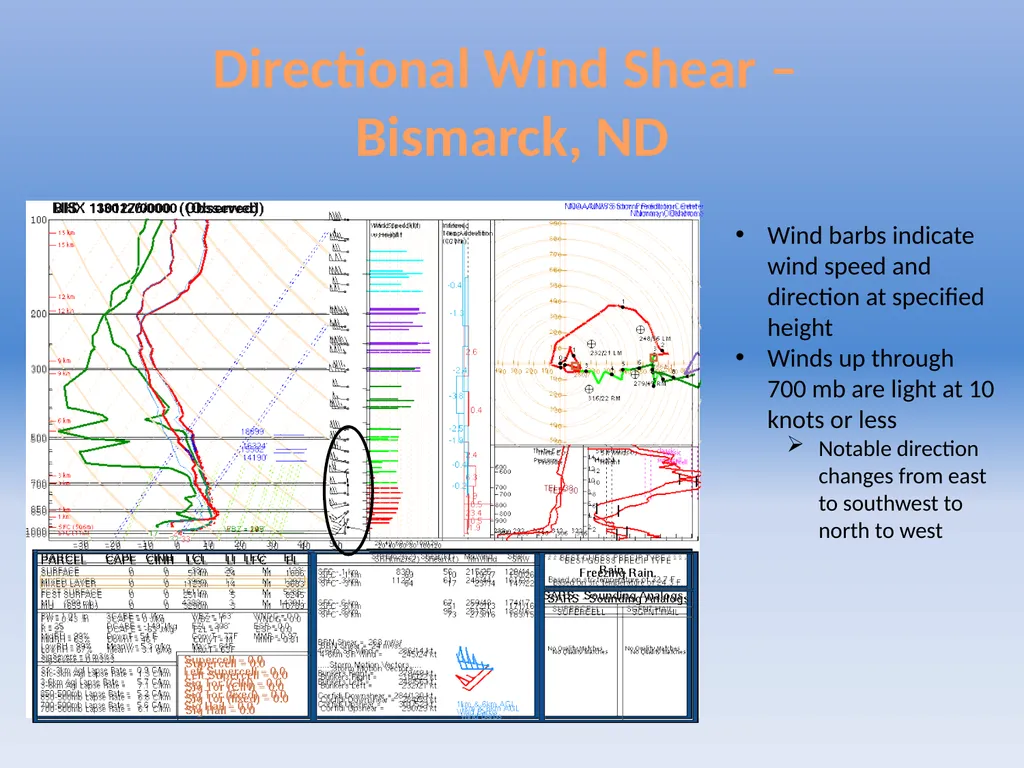
Bismarck, ND Wind barbs indicate wind speed and direction at specified height
Winds up through 700 mb are light at 10 knots or less
Notable direction changes from east to southwest to north to west<br>
08
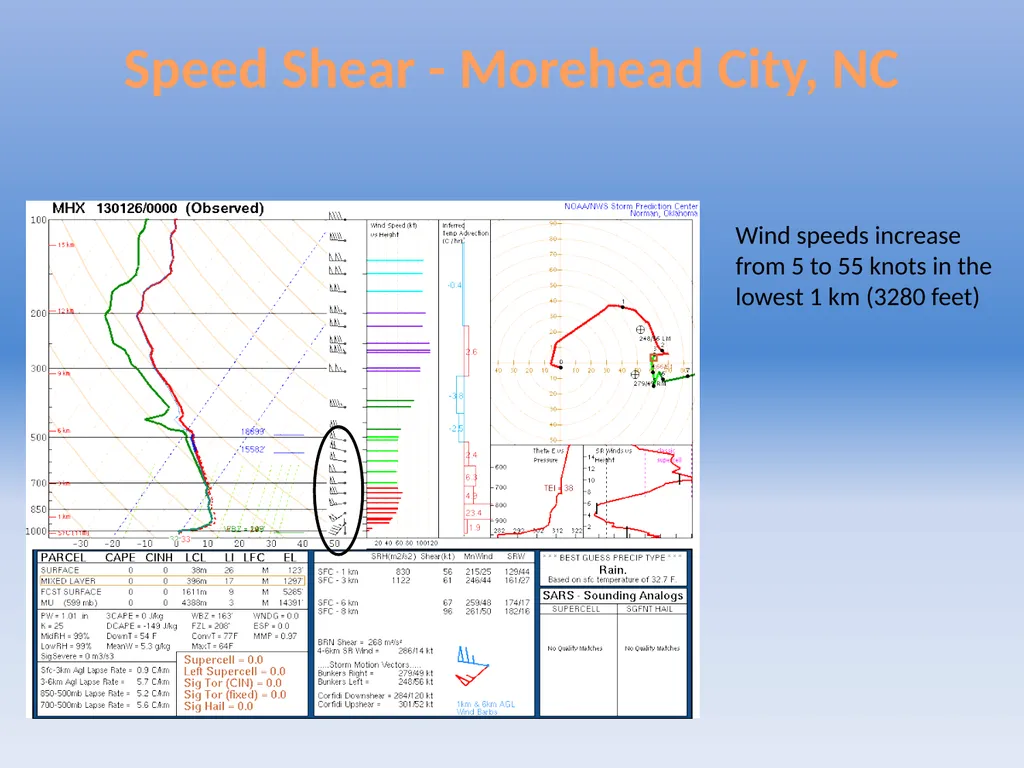
Speed Shear - Morehead City, NC Wind speeds increase from 5 to 55 knots in the lowest 1 km (3280 feet)<br>
09
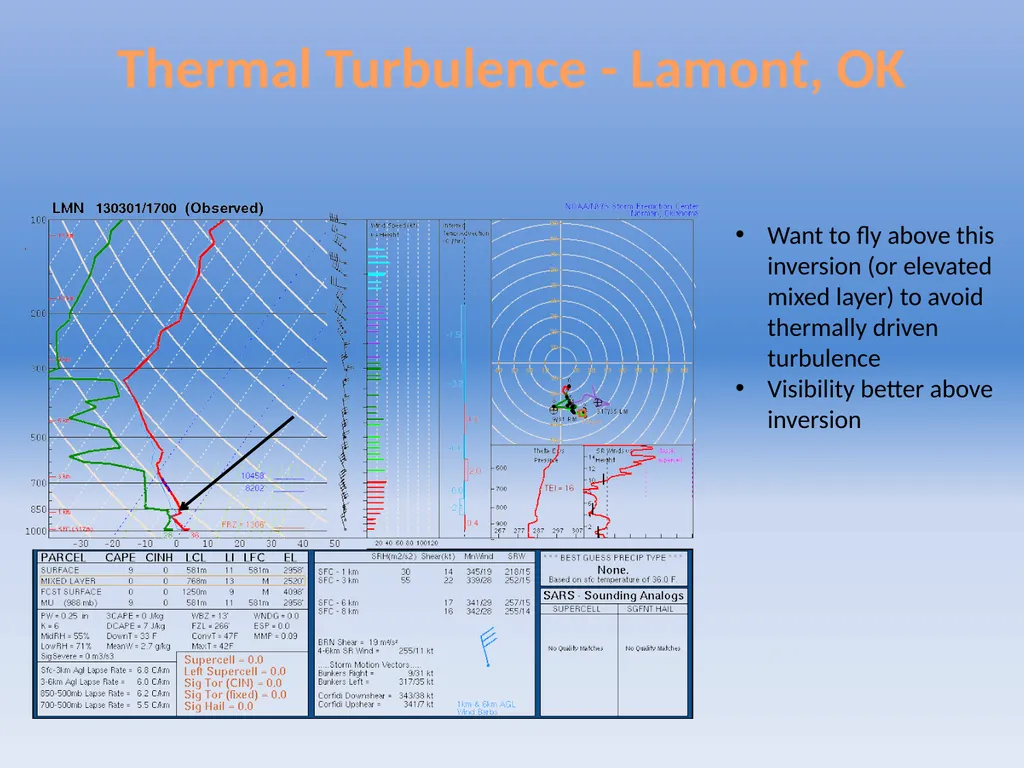
Thermal Turbulence - Lamont, OK Want to fly above this inversion (or elevated mixed layer) to avoid thermally driven turbulence
Visibility better above inversion<br>
10
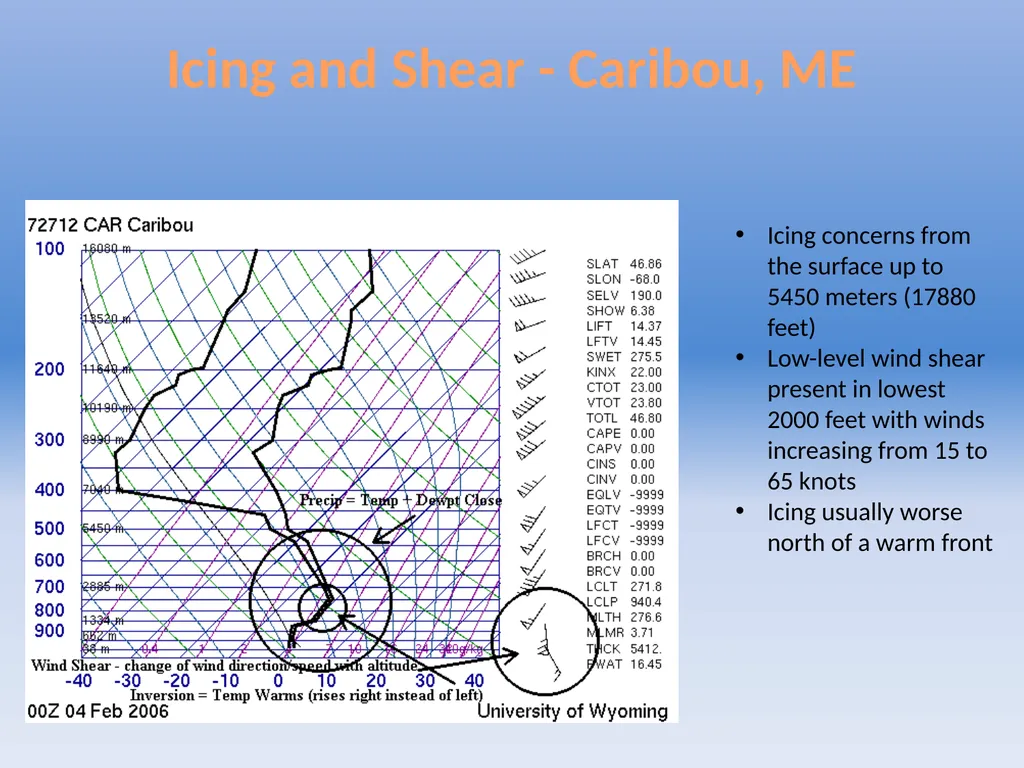
Icing and Shear - Caribou, ME Icing concerns from the surface up to 5450 meters (17880 feet)
Low-level wind shear present in lowest 2000 feet with winds increasing from 15 to 65 knots
Icing usually worse north of a warm front<br>
11
Non-Convective
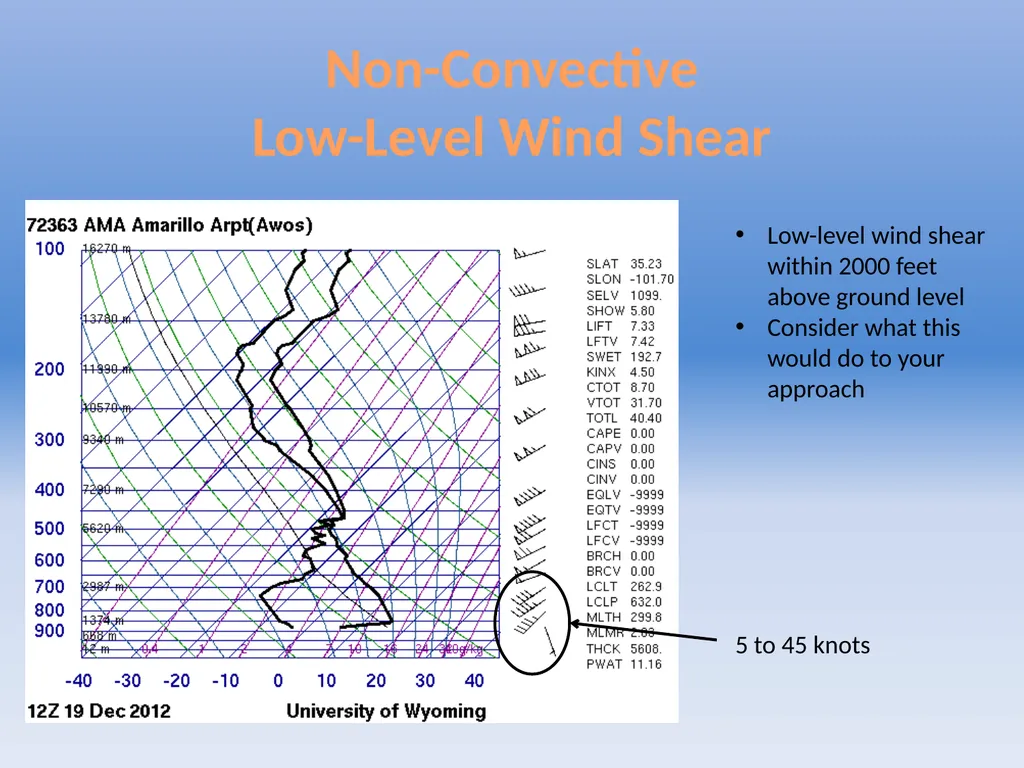
Low-Level Wind Shear Low-level wind shear within 2000 feet above ground level
Consider what this would do to your approach 5 to 45 knots<br>
12
Non-Convective
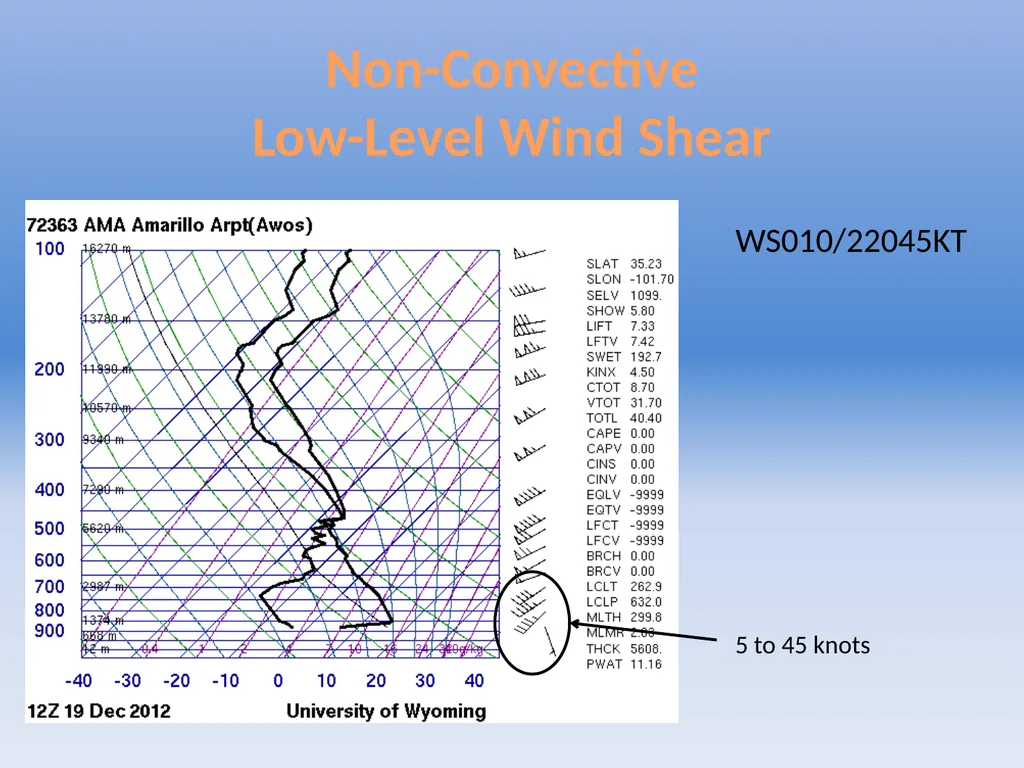
Low-Level Wind Shear WS010/22045KT 5 to 45 knots<br>
13
Terminal Aerodrome Forecast (TAF)
Within 5 statute miles of the airport terminal
Issued 4 times per day by National Weather Service Weather Forecast Offices
06, 12, 18, 24 UTC (more if amendments required)
Must now include TS to be able to place CB in TAF TAFs<br>
14
TAF KLBB 191120Z 1912/2012 21010KT P6SM SCT180 BKN250
FM191500 24015G25KT P6SM SCT150 BKN250
FM191800 26035G47KT 2SM BLDU SCT150 BKN250
FM200100 32026KT P6SM SCT250 Station Identifier Current day of month Current
time Start date & time of TAF End date & time of TAF Current wind direction Current wind speed Current
visibility Current
cloud layers Changes in prevailing conditions TAF KCDS 250520Z 2506/2606 09009KT P6SM FEW015 SCT150
TEMPO 2510/2514 6SM BR SCT010
FM251600 03012KT P6SM SCT150
FM252300 09009KT P6SM SCT120 Tempo group (probability of conditions happening > 50 % and occurring for less than half the allotted time period)<br>
15
Including Non-Convective Low-Level Wind Shear in TAFs TAF KLBB 041820Z 0400/0424 21005KT P6SM FEW040
FM040300 22010KT P6SM SCT040 WS015/23050KT
FM191800 26035G47KT 2SM BLDU SCT150 BKN250
FM200100 32026KT P6SM SCT250 Wind shear at 1500 feet above ground level with winds from 230 degrees at 50 knots<br>
16
Aviation Weather Center Products Turbulence Icing<br>
17
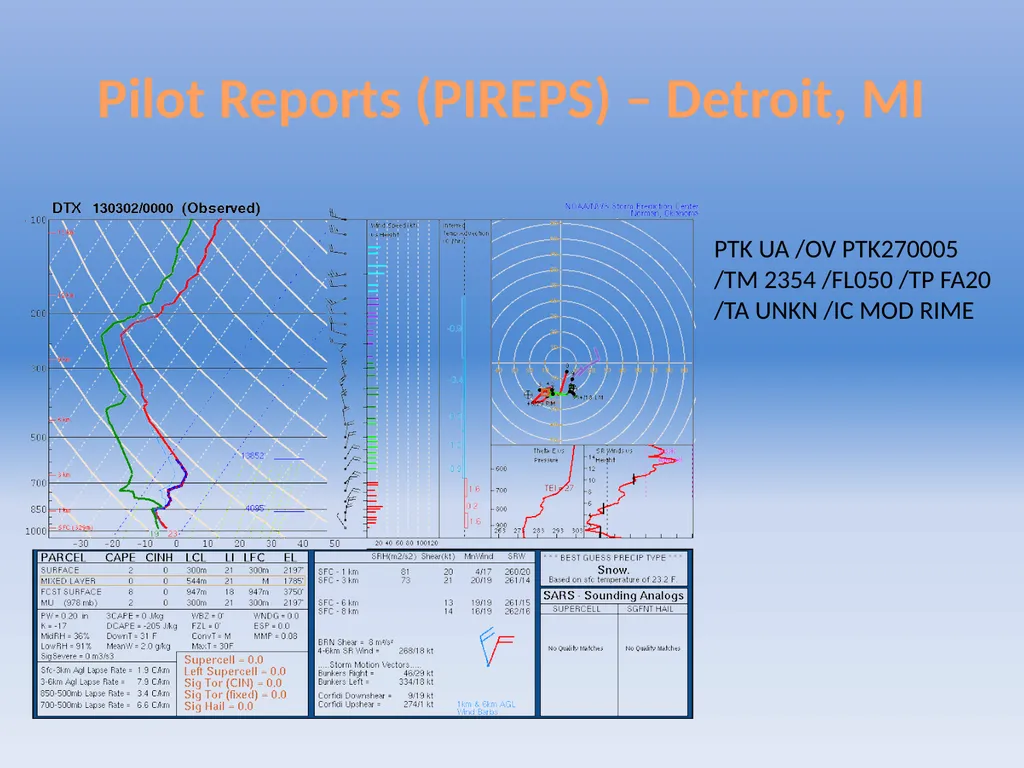
Pilot Reports (PIREPS) – Detroit, MI PTK UA /OV PTK270005
/TM 2354 /FL050 /TP FA20 /TA UNKN /IC MOD RIME<br>
18
Instrumentation errors
Measurements are only as good as the instruments making them (generally quite good)
No absolute ground/air truth – the balloon is always rising (until it pops)
Forecast model sounding errors
Due to incorrect initial conditions or errors in model processing
If possible, compare multiple models Limitations<br>
19
Real-time
http://www.spc.noaa.gov/exper/soundings/
Model
http://www.wxcaster.com/etaskewts.htm
Archive
http://weather.uwyo.edu/upperair/sounding.html Sources for Viewing Skew-Ts<br>