
Volumes of Specific substructures within the
Description: Volumes of Specific substructures within the amygdala and hippocampus are impacted by brain amyloid BETA Leema Krishna Murali, Arnaud Charil, Anthonin Reilhac-Laborde, Xin Qi Eisai Inc. USA Presentation at the 2024 Alzheimers Association
Related Topics
Download Presentation
"Volumes of Specific substructures within the" is the property of its rightful owner. Permission is granted to download and print the materials on this website for personal, non-commercial use only, and to display it on your personal computer provided you do not modify the materials and that you retain all copyright notices contained in the materials. By downloading content from our website, you accept the terms of this agreement.
Presentation Transcript
slide1. Volumes of Specific substructures within the amygdala and hippocampus are impacted by brain amyloid BETA Leema Krishna Murali, Arnaud Charil, Anthonin Reilhac-Laborde, Xin Qi
Eisai Inc. USA Presentation at the 2024 Alzheimer’s Association International Conference (AAIC) Annual Meeting. Poster # 92024 Early Stages of Alzheimer's Disease (AD): The initial phases of AD are marked by significant reductions in the volume of the medial temporal lobe, specifically affecting the amygdala and hippocampus. Research highlights the importance of measuring the volumes of specific hippocampal and amygdala subfields for early detection and differential diagnosis of AD [1].
Subfield Specific Changes and Biomarkers: Certain subfields of the hippocampus and amygdala, like the CA1 region and the subiculum, exhibit more pronounced atrophy, which correlates with the severity of mild cognitive impairment (MCI) and early AD [2]. These changes are linked to amyloid-beta deposition and cognitive decline, underscoring their potential as biomarkers for early stages of AD.
Asymmetry and Disease Progression: Studies suggest that increased asymmetry in hippocampal subfields can be biomarkers to track AD progression [3]. Asymmetry and subtle deformation patterns in these subfields are indicative of the transition from MCI to AD, providing insights into individualized treatment planning.
Machine Learning in AD Research: Machine Learning (ML) techniques are widely used for predicting various phenotypes related to AD such as for predicting amyloid and tau levels, disease staging, disease progression, etc. This can be easily extended to the use of subfields to assess the added insights and/or gain in the prediction performance. Methods (continued) References
[1] Baek, M. S., et al. (2022). J Clin Med 11(6).; [2] Saad, S. H. S., et al. (2020). Egyptian Journal of Radiology and Nuclear Medicine 51(1).; [2] den Heijer T, G. M., Hoebeek FE, Hofman A, Koudstaal PJ, Breteler (2006Arch Gen Psychiatry 63(1): 57-62.; [3] Sarica, A., et al. (2018). Front Neurosci 12: 576.; [3] Galaburda, A. M., Corsiglia, J., Rosen, G., and Sherman, G. F. (1987). Neuropsychologia 25: 853-868.
[4] Hang Qu, H. G., Liping Wang, Wei Wang & Chunhong Hu (2023). Acta Neural Bela 123: 1381-1393.; [5] Heckemann, R. A., Keihaninejad, S., Aljabar, P., Gray, K. R., Nielsen, C., and D. Rueckert, et al. ((2011). Neuroimage 56: 2024-2037.
[6] Jaramillo-Jimenez Alberto , G. L. M., Tovar-Rios Diego A. , Borda Miguel Germán , Ferreira Daniel , Brønnick Kolbjørn , Oppedal Ketil , Aarsland Dag (2021). Frontiers in Neurology 12.; [7] Kaitlin M Stouffer, X. G., Emrah Düzel, Maurits Johansson, Byron Creese, Menno P Witter, Michael I Miller, Laura E M Wisse, David Berron, (2024). Brain 147(3): 816-829.
Acknowledgments/Disclosures
We thank the patients, their families, and the sites for participating. Editorial support, funded by Eisai Inc, was provided by Mayville Medical Communications. Funding for the studies and analyses was provided by Eisai Inc. If you have any questions about this poster, please email or call Eisai Medical Information at ESI_Medinfo@eisai.com or 888-274-2378 Table 1: Demographic information of Eisai’s clinical cohort and ADNI Data and Subfield Quantification Baseline data: The data used for the study are from the Alzheimer’s Disease Neuroimaging Initiative (ADNI) cohort (n=977) and Eisai’s clinical cohort (n=3113), mostly with MCI due to AD (45% and 87% respectively). The demographic information of ADNI and Eisai’s clinical cohort are summarized in Table 1.
Standard uptake value ratio (SUVr) levels from amyloid PET scans, using various tracers, were converted to Centiloid (CL) units (Klunk, Koeppe et al. 2015) for subjects within the training and validation cohorts. In ADNI, amyloid β (Aβ) positivity was defined by a CL threshold of 20. In Eisai’s clinical cohort, Aβ positivity cut-off was derived using receiver operating characteristic (ROC) analysis. Using CL measures and visual reads (positive or negative), the CL that provided the highest Youden’s index (sensitivity + specificity - 1) was CL = 32.21.
Subfields Quantification: Freesurfer 7.2.0 enabled reliable automated segmentation of the hippocampus and amygdala into distinct subfields (Whelan et al., 2016), using Bayesian inference methods and a probabilistic atlas based on manual subfield delineations from ultra-high T1-weighted MRI scans across a variety of training subjects (Van Leemput et al., 2009; Iglesias et al., 2015). This segmentation precisely categorized the hippocampus into several areas including the parasubiculum, presubiculum, subiculum, CA1, CA3, CA4, the granule cells of the molecular layer of the dentate gyrus (GC-ML-DG), the hippocampal-amygdaloid transition area (HATA), fimbria, molecular layer, hippocampal fissure, and hippocampal tail. An expert neuroscientist visually inspected these segmentation results to ensure accuracy. In addition to the hippocampal subregions, it also simultaneously segments the nuclei of the amygdala (lateral, basal, accessory basal, central, medial, cortical and paralaminar nuclei; and cortico-amygdaloid transition and anterior amygdala areas. Statistical Analysis We conducted a series of correlation analyses to understand associations between the volume of the hippocampus or amygdala, their corresponding subfields, and regional or composite amyloid deposition at baseline and reported those that showed significant relations.
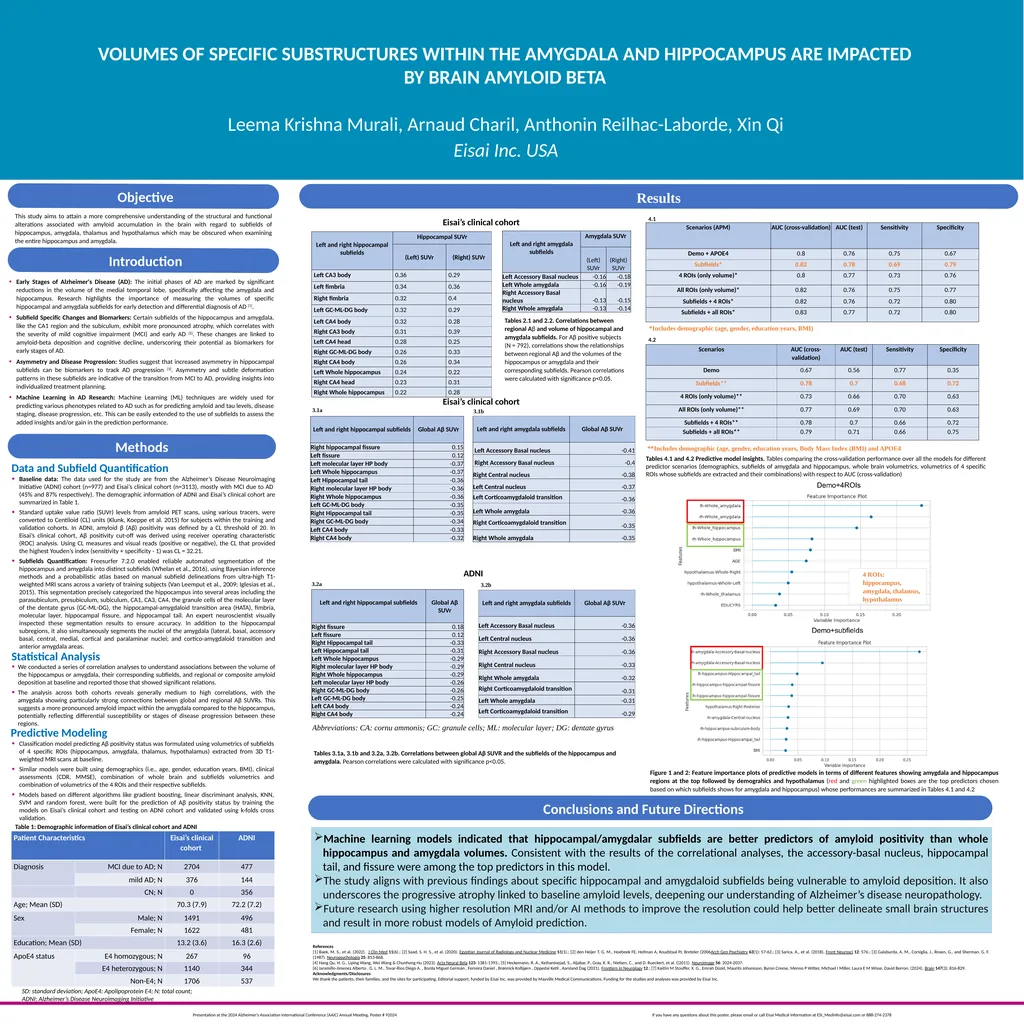
The analysis across both cohorts reveals generally medium to high correlations, with the amygdala showing particularly strong connections between global and regional Aβ SUVRs. This suggests a more pronounced amyloid impact within the amygdala compared to the hippocampus, potentially reflecting differential susceptibility or stages of disease progression between these regions. Tables 2.1 and 2.2. Correlations between regional Aβ and volume of hippocampal and amygdala subfields. For Aβ positive subjects (N = 792), correlations show the relationships between regional Aβ and the volumes of the hippocampus or amygdala and their corresponding subfields. Pearson correlations were calculated with significance p<0.05. Predictive Modeling Tables 4.1 and 4.2 Predictive model insights. Tables comparing the cross-validation performance over all the models for different predictor scenarios (demographics, subfields of amygdala and hippocampus, whole brain volumetrics, volumetrics of 4 specific ROIs whose subfields are extracted and their combinations) with respect to AUC (cross-validation) Machine learning models indicated that hippocampal/amygdalar subfields are better predictors of amyloid positivity than whole hippocampus and amygdala volumes. Consistent with the results of the correlational analyses, the accessory-basal nucleus, hippocampal tail, and fissure were among the top predictors in this model.
The study aligns with previous findings about specific hippocampal and amygdaloid subfields being vulnerable to amyloid deposition. It also underscores the progressive atrophy linked to baseline amyloid levels, deepening our understanding of Alzheimer’s disease neuropathology.
Future research using higher resolution MRI and/or AI methods to improve the resolution could help better delineate small brain structures and result in more robust models of Amyloid prediction. Classification model predicting Aβ positivity status was formulated using volumetrics of subfields of 4 specific ROIs (hippocampus, amygdala, thalamus, hypothalamus) extracted from 3D T1-weighted MRI scans at baseline.
Similar models were built using demographics (i.e., age, gender, education years, BMI), clinical assessments (CDR, MMSE), combination of whole brain and subfields volumetrics and combination of volumetrics of the 4 ROIs and their respective subfields.
Models based on different algorithms like gradient boosting, linear discriminant analysis, KNN, SVM and random forest, were built for the prediction of Aβ positivity status by training the models on Eisai’s clinical cohort and testing on ADNI cohort and validated using k-folds cross validation. Tables 3.1a, 3.1b and 3.2a, 3.2b. Correlations between global Aβ SUVR and the subfields of the hippocampus and amygdala. Pearson correlations were calculated with significance p<0.05. Figure 1 and 2: Feature importance plots of predictive models in terms of different features showing amygdala and hippocampus regions at the top followed by demograhics and hypothalamus (red and green highlighted boxes are the top predictors chosen based on which subfields shows for amygdala and hippocampus) whose performances are summarized in Tables 4.1 and 4.2 **Includes demographic (age, gender, education years, Body Mass Index (BMI) and APOE4 *Includes demographic (age, gender, education years, BMI) ADNI This study aims to attain a more comprehensive understanding of the structural and functional alterations associated with amyloid accumulation in the brain with regard to subfields of hippocampus, amygdala, thalamus and hypothalamus which may be obscured when examining the entire hippocampus and amygdala. SD: standard deviation; ApoE4: Apolipoprotein E4; N: total count;
ADNI: Alzheimer’s Disease Neuroimaging Initiative Eisai’s clinical cohort 4 ROIs: hippocampus, amygdala, thalamus, hypothalamus Eisai’s clinical cohort 3.2a Abbreviations: CA: cornu ammonis; GC: granule cells; ML: molecular layer; DG: dentate gyrus 4.1 4.2 3.1a 3.1b 3.2b<br>
Eisai Inc. USA Presentation at the 2024 Alzheimer’s Association International Conference (AAIC) Annual Meeting. Poster # 92024 Early Stages of Alzheimer's Disease (AD): The initial phases of AD are marked by significant reductions in the volume of the medial temporal lobe, specifically affecting the amygdala and hippocampus. Research highlights the importance of measuring the volumes of specific hippocampal and amygdala subfields for early detection and differential diagnosis of AD [1].
Subfield Specific Changes and Biomarkers: Certain subfields of the hippocampus and amygdala, like the CA1 region and the subiculum, exhibit more pronounced atrophy, which correlates with the severity of mild cognitive impairment (MCI) and early AD [2]. These changes are linked to amyloid-beta deposition and cognitive decline, underscoring their potential as biomarkers for early stages of AD.
Asymmetry and Disease Progression: Studies suggest that increased asymmetry in hippocampal subfields can be biomarkers to track AD progression [3]. Asymmetry and subtle deformation patterns in these subfields are indicative of the transition from MCI to AD, providing insights into individualized treatment planning.
Machine Learning in AD Research: Machine Learning (ML) techniques are widely used for predicting various phenotypes related to AD such as for predicting amyloid and tau levels, disease staging, disease progression, etc. This can be easily extended to the use of subfields to assess the added insights and/or gain in the prediction performance. Methods (continued) References
[1] Baek, M. S., et al. (2022). J Clin Med 11(6).; [2] Saad, S. H. S., et al. (2020). Egyptian Journal of Radiology and Nuclear Medicine 51(1).; [2] den Heijer T, G. M., Hoebeek FE, Hofman A, Koudstaal PJ, Breteler (2006Arch Gen Psychiatry 63(1): 57-62.; [3] Sarica, A., et al. (2018). Front Neurosci 12: 576.; [3] Galaburda, A. M., Corsiglia, J., Rosen, G., and Sherman, G. F. (1987). Neuropsychologia 25: 853-868.
[4] Hang Qu, H. G., Liping Wang, Wei Wang & Chunhong Hu (2023). Acta Neural Bela 123: 1381-1393.; [5] Heckemann, R. A., Keihaninejad, S., Aljabar, P., Gray, K. R., Nielsen, C., and D. Rueckert, et al. ((2011). Neuroimage 56: 2024-2037.
[6] Jaramillo-Jimenez Alberto , G. L. M., Tovar-Rios Diego A. , Borda Miguel Germán , Ferreira Daniel , Brønnick Kolbjørn , Oppedal Ketil , Aarsland Dag (2021). Frontiers in Neurology 12.; [7] Kaitlin M Stouffer, X. G., Emrah Düzel, Maurits Johansson, Byron Creese, Menno P Witter, Michael I Miller, Laura E M Wisse, David Berron, (2024). Brain 147(3): 816-829.
Acknowledgments/Disclosures
We thank the patients, their families, and the sites for participating. Editorial support, funded by Eisai Inc, was provided by Mayville Medical Communications. Funding for the studies and analyses was provided by Eisai Inc. If you have any questions about this poster, please email or call Eisai Medical Information at ESI_Medinfo@eisai.com or 888-274-2378 Table 1: Demographic information of Eisai’s clinical cohort and ADNI Data and Subfield Quantification Baseline data: The data used for the study are from the Alzheimer’s Disease Neuroimaging Initiative (ADNI) cohort (n=977) and Eisai’s clinical cohort (n=3113), mostly with MCI due to AD (45% and 87% respectively). The demographic information of ADNI and Eisai’s clinical cohort are summarized in Table 1.
Standard uptake value ratio (SUVr) levels from amyloid PET scans, using various tracers, were converted to Centiloid (CL) units (Klunk, Koeppe et al. 2015) for subjects within the training and validation cohorts. In ADNI, amyloid β (Aβ) positivity was defined by a CL threshold of 20. In Eisai’s clinical cohort, Aβ positivity cut-off was derived using receiver operating characteristic (ROC) analysis. Using CL measures and visual reads (positive or negative), the CL that provided the highest Youden’s index (sensitivity + specificity - 1) was CL = 32.21.
Subfields Quantification: Freesurfer 7.2.0 enabled reliable automated segmentation of the hippocampus and amygdala into distinct subfields (Whelan et al., 2016), using Bayesian inference methods and a probabilistic atlas based on manual subfield delineations from ultra-high T1-weighted MRI scans across a variety of training subjects (Van Leemput et al., 2009; Iglesias et al., 2015). This segmentation precisely categorized the hippocampus into several areas including the parasubiculum, presubiculum, subiculum, CA1, CA3, CA4, the granule cells of the molecular layer of the dentate gyrus (GC-ML-DG), the hippocampal-amygdaloid transition area (HATA), fimbria, molecular layer, hippocampal fissure, and hippocampal tail. An expert neuroscientist visually inspected these segmentation results to ensure accuracy. In addition to the hippocampal subregions, it also simultaneously segments the nuclei of the amygdala (lateral, basal, accessory basal, central, medial, cortical and paralaminar nuclei; and cortico-amygdaloid transition and anterior amygdala areas. Statistical Analysis We conducted a series of correlation analyses to understand associations between the volume of the hippocampus or amygdala, their corresponding subfields, and regional or composite amyloid deposition at baseline and reported those that showed significant relations.
The analysis across both cohorts reveals generally medium to high correlations, with the amygdala showing particularly strong connections between global and regional Aβ SUVRs. This suggests a more pronounced amyloid impact within the amygdala compared to the hippocampus, potentially reflecting differential susceptibility or stages of disease progression between these regions. Tables 2.1 and 2.2. Correlations between regional Aβ and volume of hippocampal and amygdala subfields. For Aβ positive subjects (N = 792), correlations show the relationships between regional Aβ and the volumes of the hippocampus or amygdala and their corresponding subfields. Pearson correlations were calculated with significance p<0.05. Predictive Modeling Tables 4.1 and 4.2 Predictive model insights. Tables comparing the cross-validation performance over all the models for different predictor scenarios (demographics, subfields of amygdala and hippocampus, whole brain volumetrics, volumetrics of 4 specific ROIs whose subfields are extracted and their combinations) with respect to AUC (cross-validation) Machine learning models indicated that hippocampal/amygdalar subfields are better predictors of amyloid positivity than whole hippocampus and amygdala volumes. Consistent with the results of the correlational analyses, the accessory-basal nucleus, hippocampal tail, and fissure were among the top predictors in this model.
The study aligns with previous findings about specific hippocampal and amygdaloid subfields being vulnerable to amyloid deposition. It also underscores the progressive atrophy linked to baseline amyloid levels, deepening our understanding of Alzheimer’s disease neuropathology.
Future research using higher resolution MRI and/or AI methods to improve the resolution could help better delineate small brain structures and result in more robust models of Amyloid prediction. Classification model predicting Aβ positivity status was formulated using volumetrics of subfields of 4 specific ROIs (hippocampus, amygdala, thalamus, hypothalamus) extracted from 3D T1-weighted MRI scans at baseline.
Similar models were built using demographics (i.e., age, gender, education years, BMI), clinical assessments (CDR, MMSE), combination of whole brain and subfields volumetrics and combination of volumetrics of the 4 ROIs and their respective subfields.
Models based on different algorithms like gradient boosting, linear discriminant analysis, KNN, SVM and random forest, were built for the prediction of Aβ positivity status by training the models on Eisai’s clinical cohort and testing on ADNI cohort and validated using k-folds cross validation. Tables 3.1a, 3.1b and 3.2a, 3.2b. Correlations between global Aβ SUVR and the subfields of the hippocampus and amygdala. Pearson correlations were calculated with significance p<0.05. Figure 1 and 2: Feature importance plots of predictive models in terms of different features showing amygdala and hippocampus regions at the top followed by demograhics and hypothalamus (red and green highlighted boxes are the top predictors chosen based on which subfields shows for amygdala and hippocampus) whose performances are summarized in Tables 4.1 and 4.2 **Includes demographic (age, gender, education years, Body Mass Index (BMI) and APOE4 *Includes demographic (age, gender, education years, BMI) ADNI This study aims to attain a more comprehensive understanding of the structural and functional alterations associated with amyloid accumulation in the brain with regard to subfields of hippocampus, amygdala, thalamus and hypothalamus which may be obscured when examining the entire hippocampus and amygdala. SD: standard deviation; ApoE4: Apolipoprotein E4; N: total count;
ADNI: Alzheimer’s Disease Neuroimaging Initiative Eisai’s clinical cohort 4 ROIs: hippocampus, amygdala, thalamus, hypothalamus Eisai’s clinical cohort 3.2a Abbreviations: CA: cornu ammonis; GC: granule cells; ML: molecular layer; DG: dentate gyrus 4.1 4.2 3.1a 3.1b 3.2b<br>