
www.pwc.com Introductory concepts Welcome! 2
MT
Published · 51 slides · 0 views

1 / 1






Description
www.pwc.com Introductory concepts Welcome! 2 Course objectives 3 Demonstrate knowledge of terms, methods, and tools for data management and analysis Demonstrate knowledge of trends in data management and analysis Demonstrate how to acquire,
Related Topics
Share
Embed code
Download this presentation From Below
"www.pwc.com Introductory concepts Welcome! 2" is the property of its rightful owner. Permission is granted to download and print the materials on this website for personal, non-commercial use only, and to display it on your personal computer provided you do not modify the materials and that you retain all copyright notices contained in the materials. By downloading content from our website, you accept the terms of this agreement.
Presentation Transcript
01
www.pwc.com Introductory concepts<br>
02
Welcome! 2<br>
03
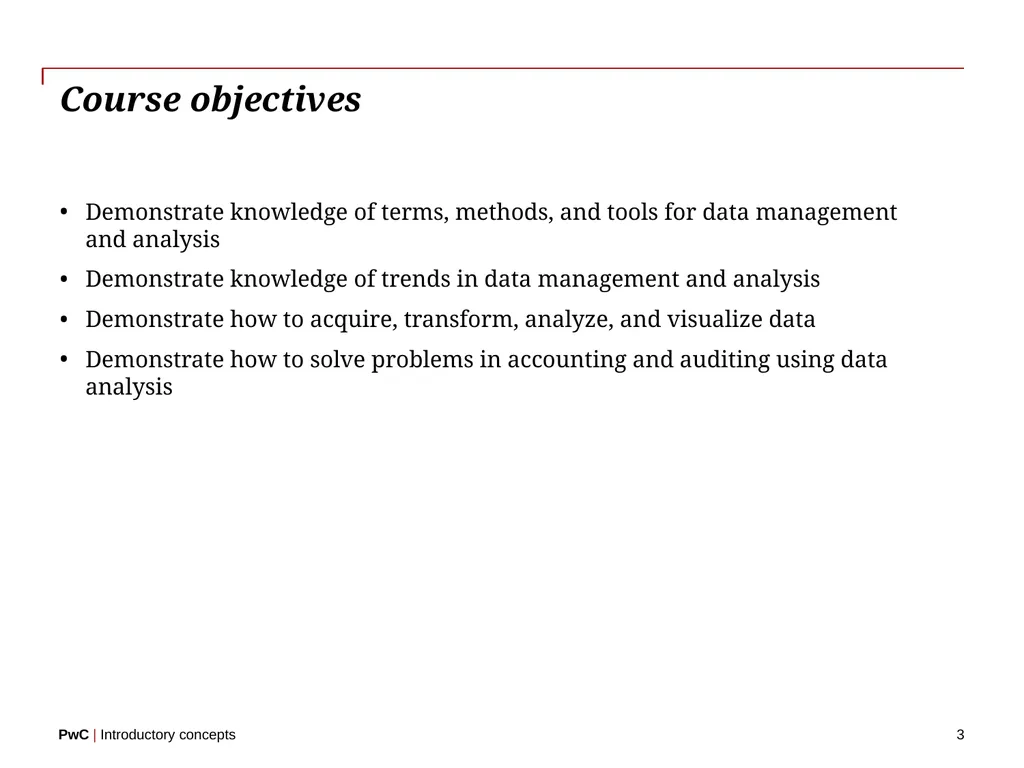
Course objectives 3 Demonstrate knowledge of terms, methods, and tools for data management
and analysis
Demonstrate knowledge of trends in data management and analysis
Demonstrate how to acquire, transform, analyze, and visualize data
Demonstrate how to solve problems in accounting and auditing using data analysis<br>
Demonstrate knowledge of trends in data management and analysis
Demonstrate how to acquire, transform, analyze, and visualize data
Demonstrate how to solve problems in accounting and auditing using data analysis<br>
04
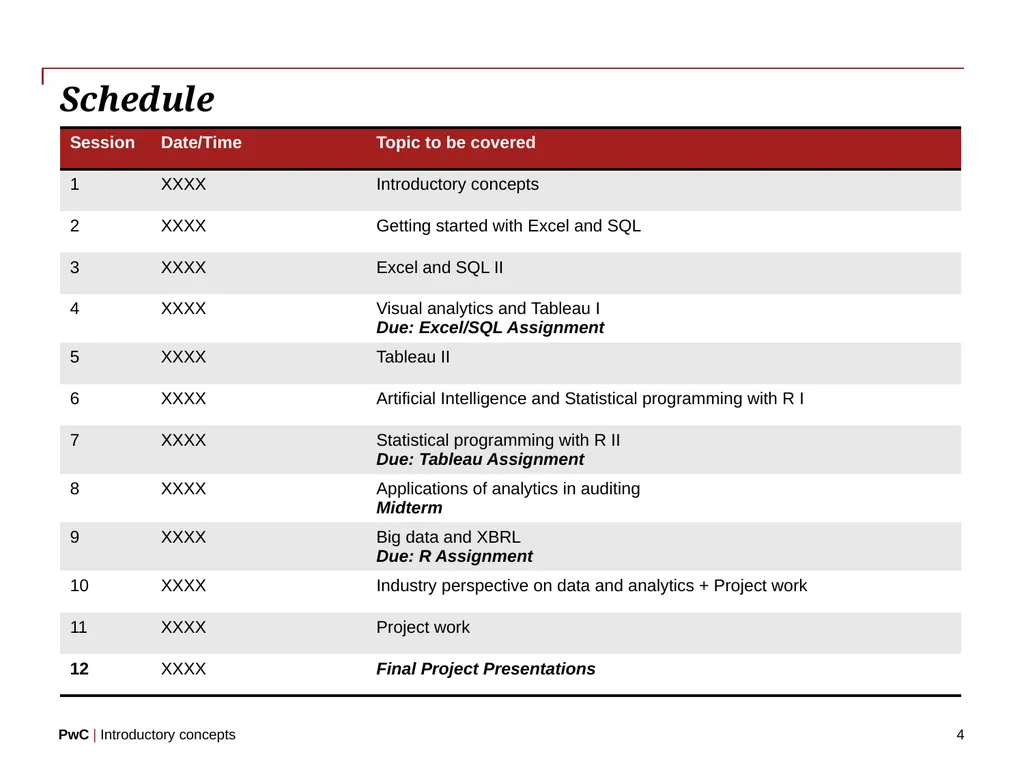
Schedule 4<br>
05
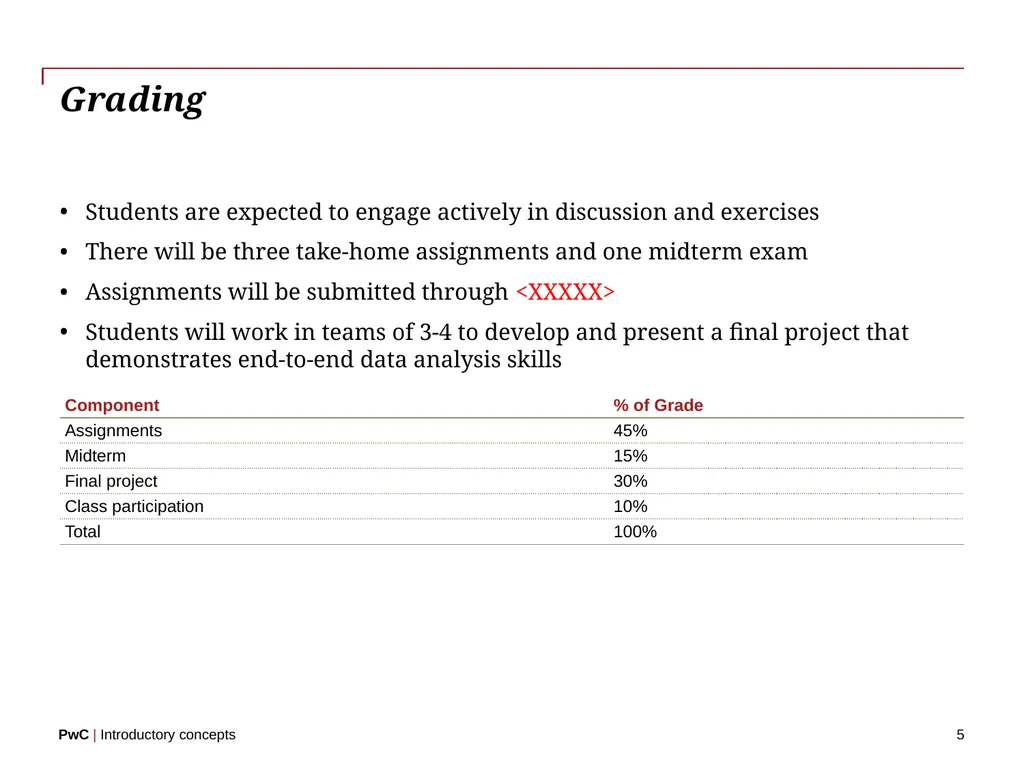
Grading 5 Students are expected to engage actively in discussion and exercises
There will be three take-home assignments and one midterm exam
Assignments will be submitted through <XXXXX>
Students will work in teams of 3-4 to develop and present a final project that demonstrates end-to-end data analysis skills<br>
There will be three take-home assignments and one midterm exam
Assignments will be submitted through <XXXXX>
Students will work in teams of 3-4 to develop and present a final project that demonstrates end-to-end data analysis skills<br>
06
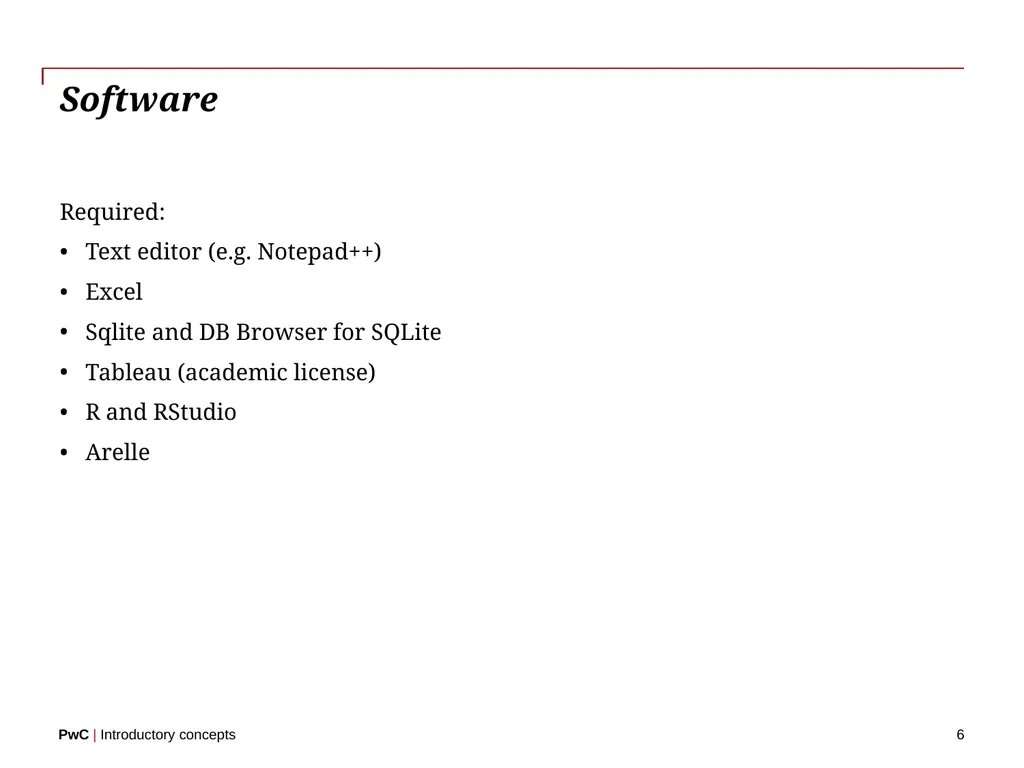
Software 6 Required:
Text editor (e.g. Notepad++)
Excel
Sqlite and DB Browser for SQLite
Tableau (academic license)
R and RStudio
Arelle<br>
Text editor (e.g. Notepad++)
Excel
Sqlite and DB Browser for SQLite
Tableau (academic license)
R and RStudio
Arelle<br>
07
Starting the discussion 7 Who has created a pivot table in Excel?
Who has used a database? Which one? What did you use it for?
What kinds of data visualizations have you created? Dashboards?
Who has created a predictive model? What methods did you use?
Who has programming experience? What languages?
Who has used data analysis in a business or work context?<br>
Who has used a database? Which one? What did you use it for?
What kinds of data visualizations have you created? Dashboards?
Who has created a predictive model? What methods did you use?
Who has programming experience? What languages?
Who has used data analysis in a business or work context?<br>
08
Class objectives 8 Define key terms related to data management and analytics
Motivate the study of data and methods of analysis
Establish a framework for using data to answer questions and solve problems
Demonstrate knowledge of key tasks in data management and analysis<br>
Motivate the study of data and methods of analysis
Establish a framework for using data to answer questions and solve problems
Demonstrate knowledge of key tasks in data management and analysis<br>
09
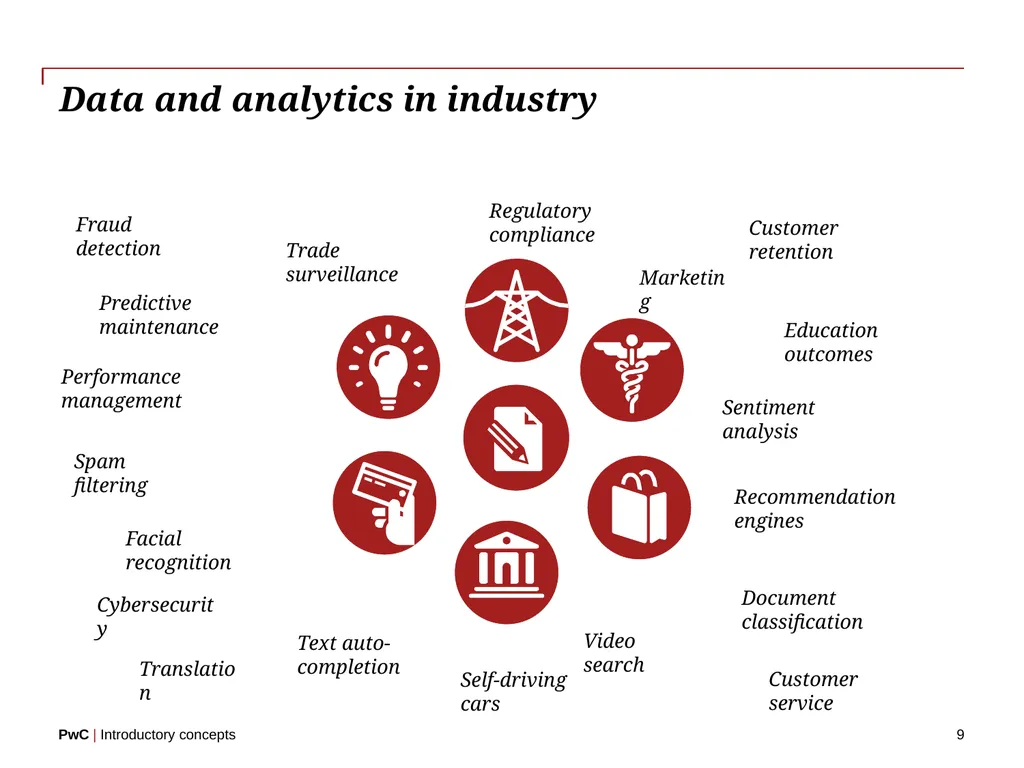
Data and analytics in industry 9 Trade surveillance Predictive maintenance Performance management Marketing Spam filtering Sentiment analysis Document classification Facial recognition Education outcomes Video search Recommendation engines Customer retention Cybersecurity Text auto-completion Regulatory compliance Customer service Fraud detection Translation Self-driving cars<br>
10
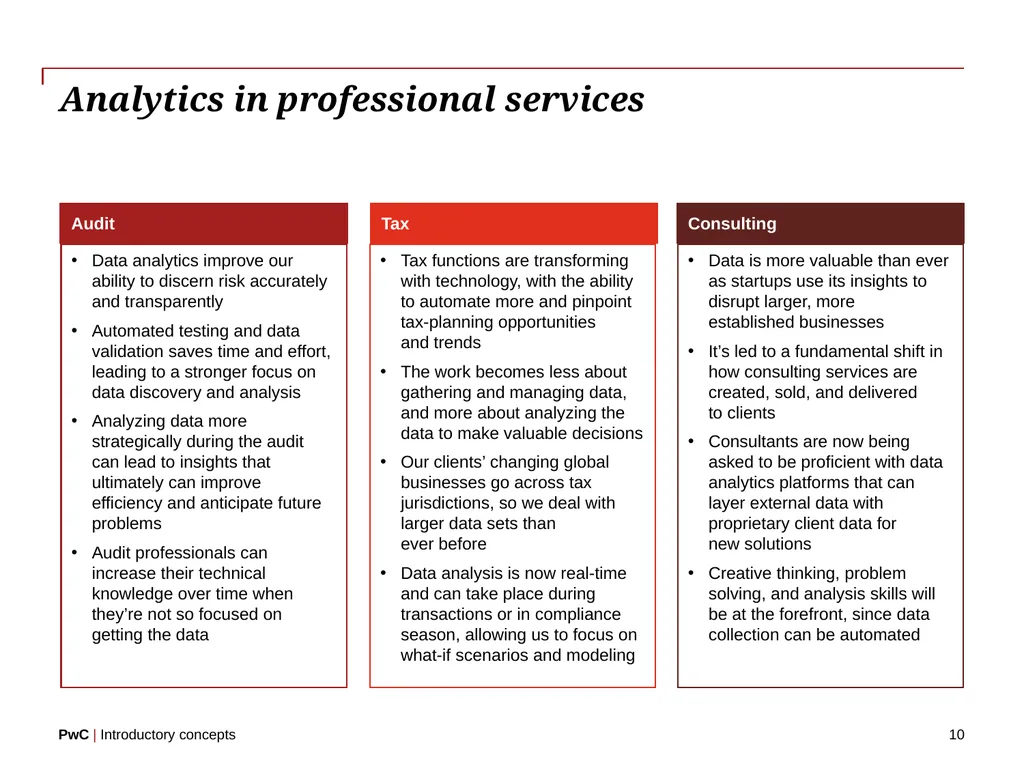
Analytics in professional services 10 Tax functions are transforming with technology, with the ability to automate more and pinpoint tax-planning opportunities
and trends
The work becomes less about gathering and managing data, and more about analyzing the data to make valuable decisions
Our clients’ changing global businesses go across tax jurisdictions, so we deal with larger data sets than ever before
Data analysis is now real-time and can take place during transactions or in compliance season, allowing us to focus on what-if scenarios and modeling Data analytics improve our ability to discern risk accurately and transparently
Automated testing and data validation saves time and effort, leading to a stronger focus on data discovery and analysis
Analyzing data more strategically during the audit can lead to insights that ultimately can improve efficiency and anticipate future problems
Audit professionals can increase their technical knowledge over time when they’re not so focused on getting the data Data is more valuable than ever as startups use its insights to disrupt larger, more established businesses
It’s led to a fundamental shift in how consulting services are created, sold, and delivered to clients
Consultants are now being asked to be proficient with data analytics platforms that can layer external data with proprietary client data for new solutions
Creative thinking, problem solving, and analysis skills will be at the forefront, since data collection can be automated Consulting Tax Audit<br>
The work becomes less about gathering and managing data, and more about analyzing the data to make valuable decisions
Our clients’ changing global businesses go across tax jurisdictions, so we deal with larger data sets than ever before
Data analysis is now real-time and can take place during transactions or in compliance season, allowing us to focus on what-if scenarios and modeling Data analytics improve our ability to discern risk accurately and transparently
Automated testing and data validation saves time and effort, leading to a stronger focus on data discovery and analysis
Analyzing data more strategically during the audit can lead to insights that ultimately can improve efficiency and anticipate future problems
Audit professionals can increase their technical knowledge over time when they’re not so focused on getting the data Data is more valuable than ever as startups use its insights to disrupt larger, more established businesses
It’s led to a fundamental shift in how consulting services are created, sold, and delivered to clients
Consultants are now being asked to be proficient with data analytics platforms that can layer external data with proprietary client data for new solutions
Creative thinking, problem solving, and analysis skills will be at the forefront, since data collection can be automated Consulting Tax Audit<br>
11
Analytics in accounting and auditing 11 Journal Entry Testing: Source, manual/automated, trending, users activity, unusual and common entries
Reconciliation: Summary system reports to raw data comparison, reserve study insurance triangles to source recon, multiple data source reconciliation, completeness & occurrence check
Reperformance: Repeating system key calculation activities, validation or business rules and testing client data process
Text Analytics: Paper contracts to visual dashboards, PDF invoice reconciliation to GL Key Calculations: Interest expense allocation, amortization, initial direct costs, unearned income
IT General Controls: Application logical security, change management, database logical security, revocation testing, segregation of duties
Key Report Testing: Contract modifications, payroll and wire transfer disbursements, financial disclosures, privileged access usage Accounts Payable: Duplicate vendor/payment, one-time payments, restricted vendors, lost accounts
Fraud, Waste, & Abuse: Asset misappropriation, financial statement fraud
Partial Divestiture: Financial statement reporting, IT infrastructure separation, allocation of assets and liabilities Risk Assessment Substantive Testing Internal Controls<br>
Reconciliation: Summary system reports to raw data comparison, reserve study insurance triangles to source recon, multiple data source reconciliation, completeness & occurrence check
Reperformance: Repeating system key calculation activities, validation or business rules and testing client data process
Text Analytics: Paper contracts to visual dashboards, PDF invoice reconciliation to GL Key Calculations: Interest expense allocation, amortization, initial direct costs, unearned income
IT General Controls: Application logical security, change management, database logical security, revocation testing, segregation of duties
Key Report Testing: Contract modifications, payroll and wire transfer disbursements, financial disclosures, privileged access usage Accounts Payable: Duplicate vendor/payment, one-time payments, restricted vendors, lost accounts
Fraud, Waste, & Abuse: Asset misappropriation, financial statement fraud
Partial Divestiture: Financial statement reporting, IT infrastructure separation, allocation of assets and liabilities Risk Assessment Substantive Testing Internal Controls<br>
12
Introductory concepts 12<br>
13
Discussion – How would you define these terms? 13 Data
Data science
Data management
Data analytics<br>
Data science
Data management
Data analytics<br>
14
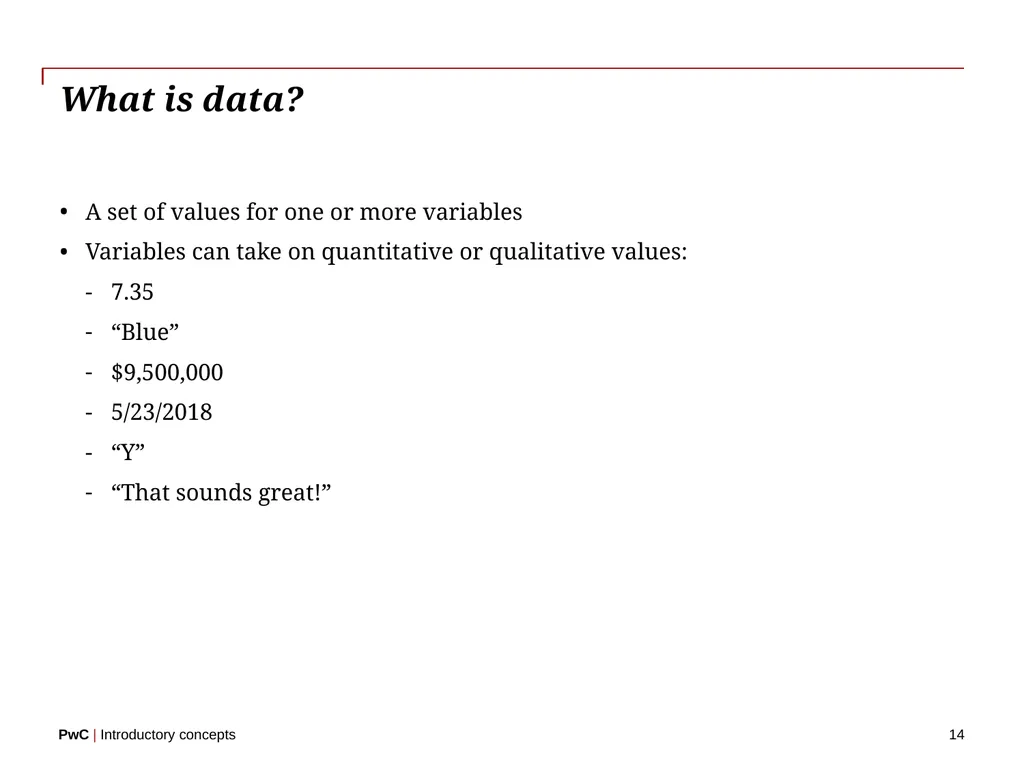
What is data? 14 A set of values for one or more variables
Variables can take on quantitative or qualitative values:
7.35
“Blue”
$9,500,000
5/23/2018
“Y”
“That sounds great!”<br>
Variables can take on quantitative or qualitative values:
7.35
“Blue”
$9,500,000
5/23/2018
“Y”
“That sounds great!”<br>
15
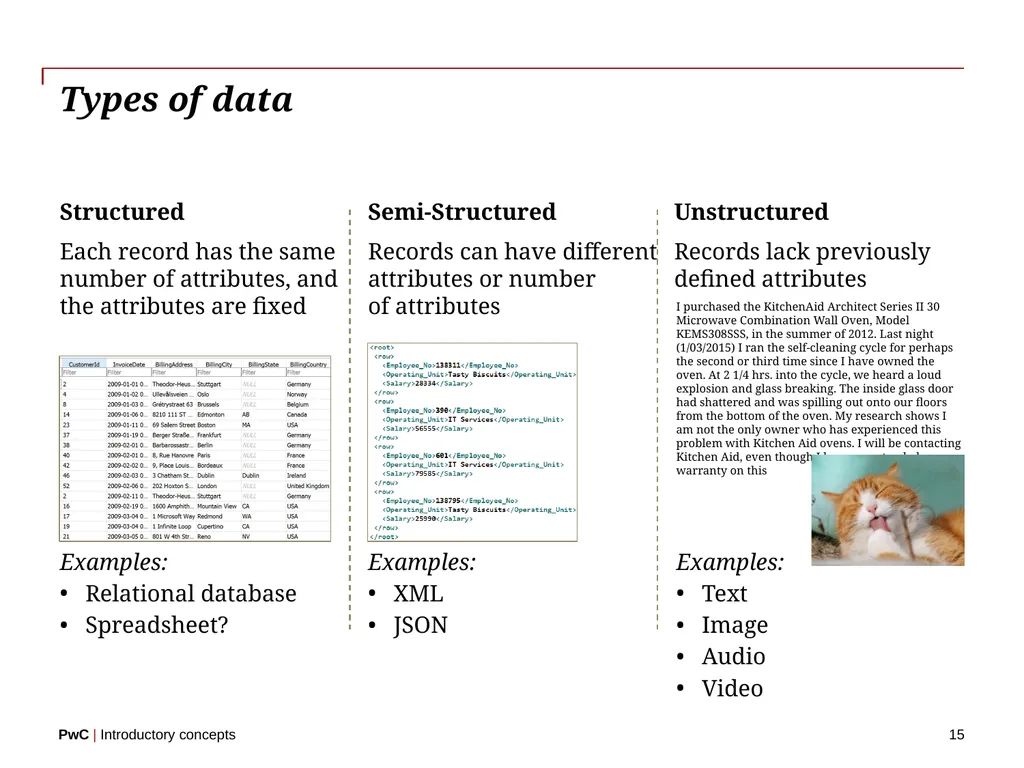
Types of data 15 Structured
Each record has the same number of attributes, and the attributes are fixed Semi-Structured
Records can have different attributes or number of attributes Unstructured
Records lack previously defined attributes Examples:
Relational database
Spreadsheet? Examples:
XML
JSON Examples:
Text
Image
Audio
Video I purchased the KitchenAid Architect Series II 30 Microwave Combination Wall Oven, Model KEMS308SSS, in the summer of 2012. Last night (1/03/2015) I ran the self-cleaning cycle for perhaps the second or third time since I have owned the oven. At 2 1/4 hrs. into the cycle, we heard a loud explosion and glass breaking. The inside glass door had shattered and was spilling out onto our floors from the bottom of the oven. My research shows I am not the only owner who has experienced this problem with Kitchen Aid ovens. I will be contacting Kitchen Aid, even though I have an extended warranty on this<br>
Each record has the same number of attributes, and the attributes are fixed Semi-Structured
Records can have different attributes or number of attributes Unstructured
Records lack previously defined attributes Examples:
Relational database
Spreadsheet? Examples:
XML
JSON Examples:
Text
Image
Audio
Video I purchased the KitchenAid Architect Series II 30 Microwave Combination Wall Oven, Model KEMS308SSS, in the summer of 2012. Last night (1/03/2015) I ran the self-cleaning cycle for perhaps the second or third time since I have owned the oven. At 2 1/4 hrs. into the cycle, we heard a loud explosion and glass breaking. The inside glass door had shattered and was spilling out onto our floors from the bottom of the oven. My research shows I am not the only owner who has experienced this problem with Kitchen Aid ovens. I will be contacting Kitchen Aid, even though I have an extended warranty on this<br>
16
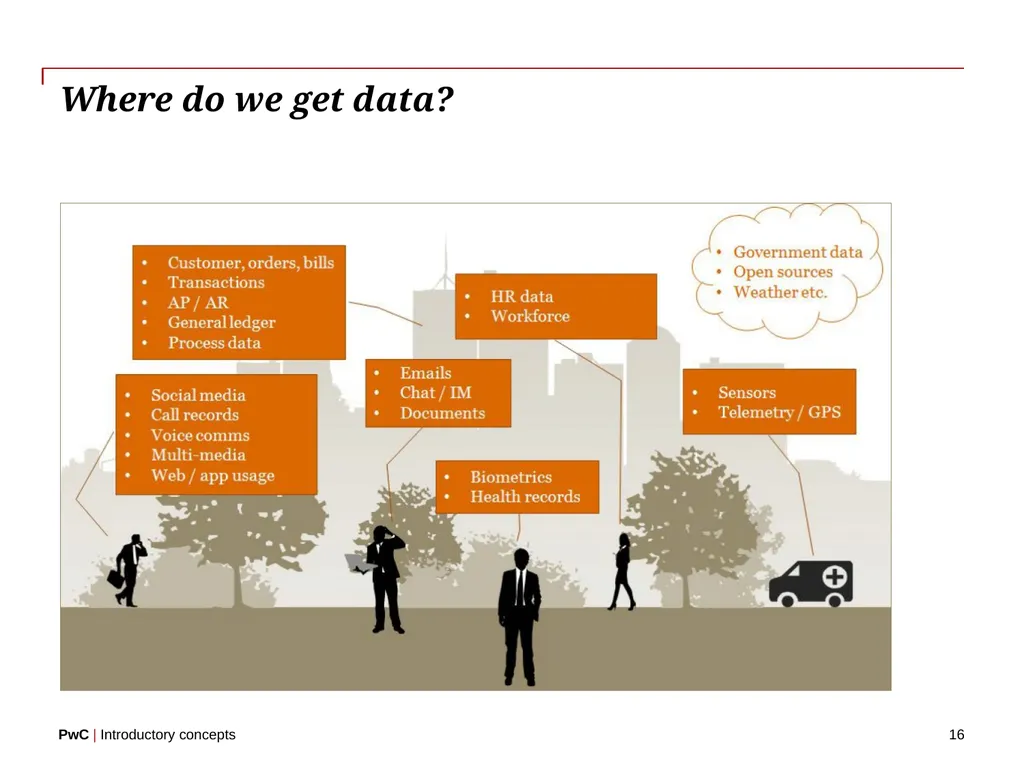
Where do we get data? 16<br>
17
What have you done in the last six months? 17 Purchased music on iTunes, Pandora, or Spotify?
Clicked an ad on a web site?
Used a mapping application such as Google Maps?
Bought and wore a fitness wristband?
Viewed trending topics on Twitter?<br>
Clicked an ad on a web site?
Used a mapping application such as Google Maps?
Bought and wore a fitness wristband?
Viewed trending topics on Twitter?<br>
18
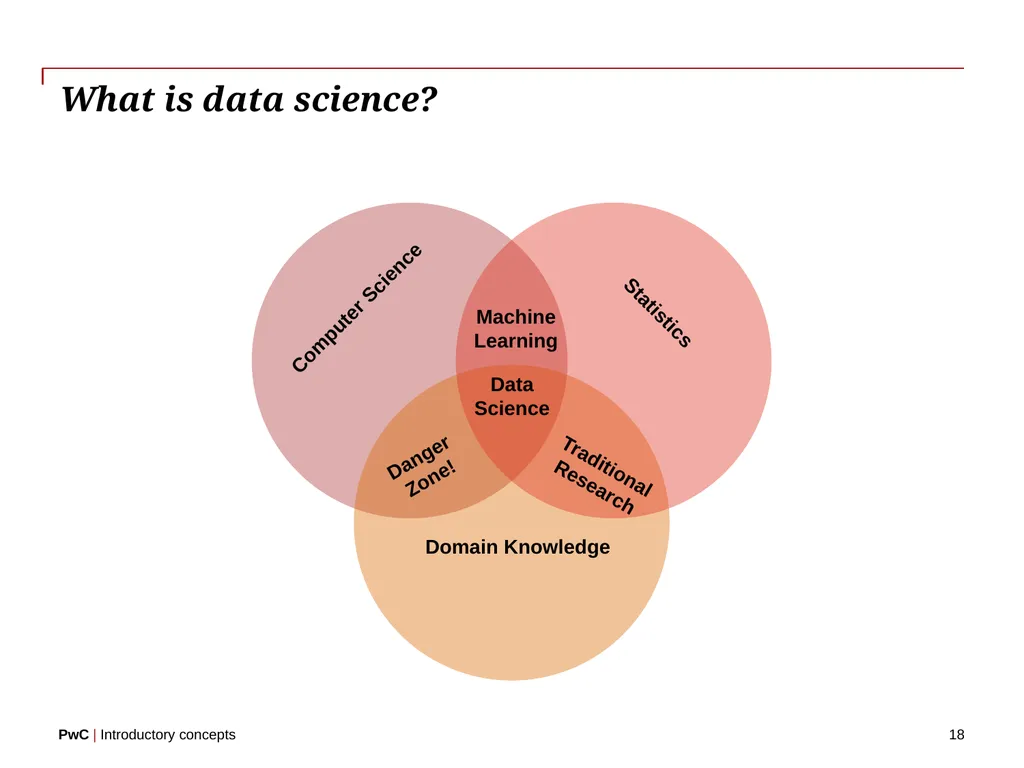
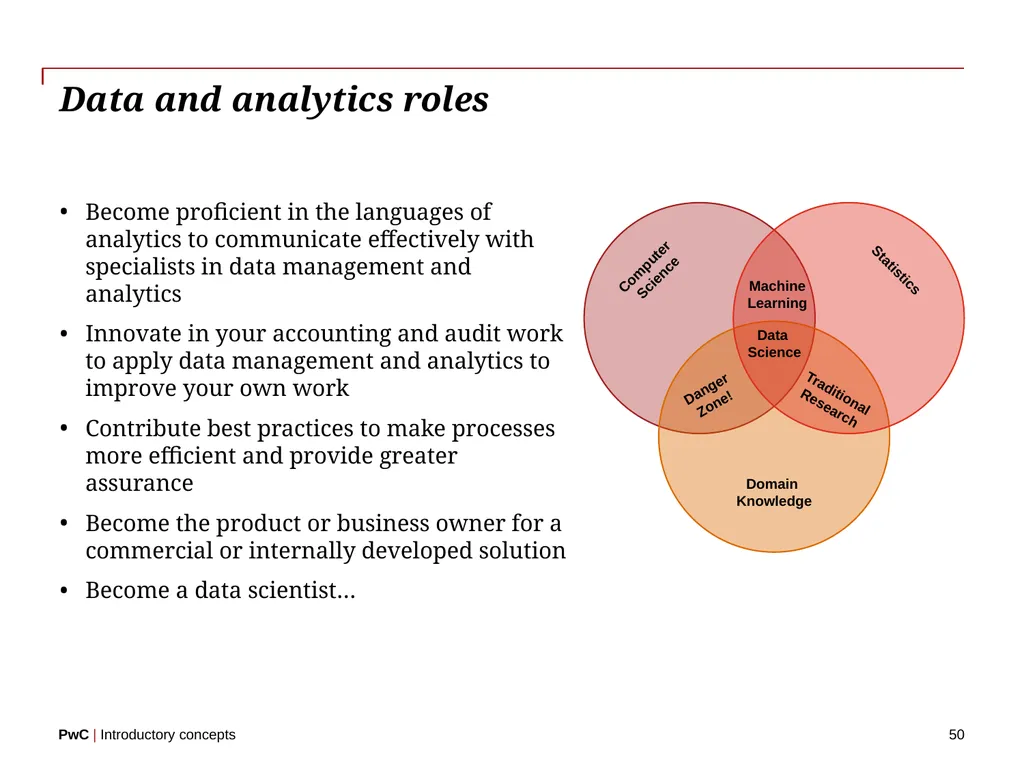
What is data science? 18 Computer Science Statistics Domain Knowledge Data Science Danger Zone! Traditional Research Machine Learning<br>
19
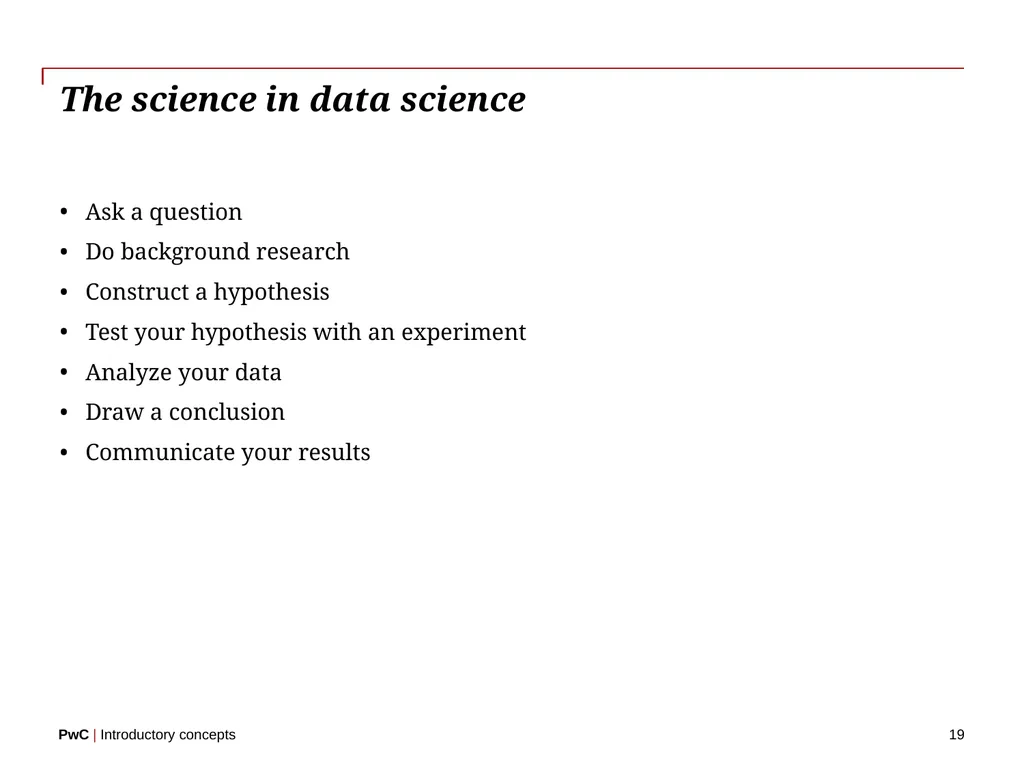
The science in data science 19 Ask a question
Do background research
Construct a hypothesis
Test your hypothesis with an experiment
Analyze your data
Draw a conclusion
Communicate your results<br>
Do background research
Construct a hypothesis
Test your hypothesis with an experiment
Analyze your data
Draw a conclusion
Communicate your results<br>
20
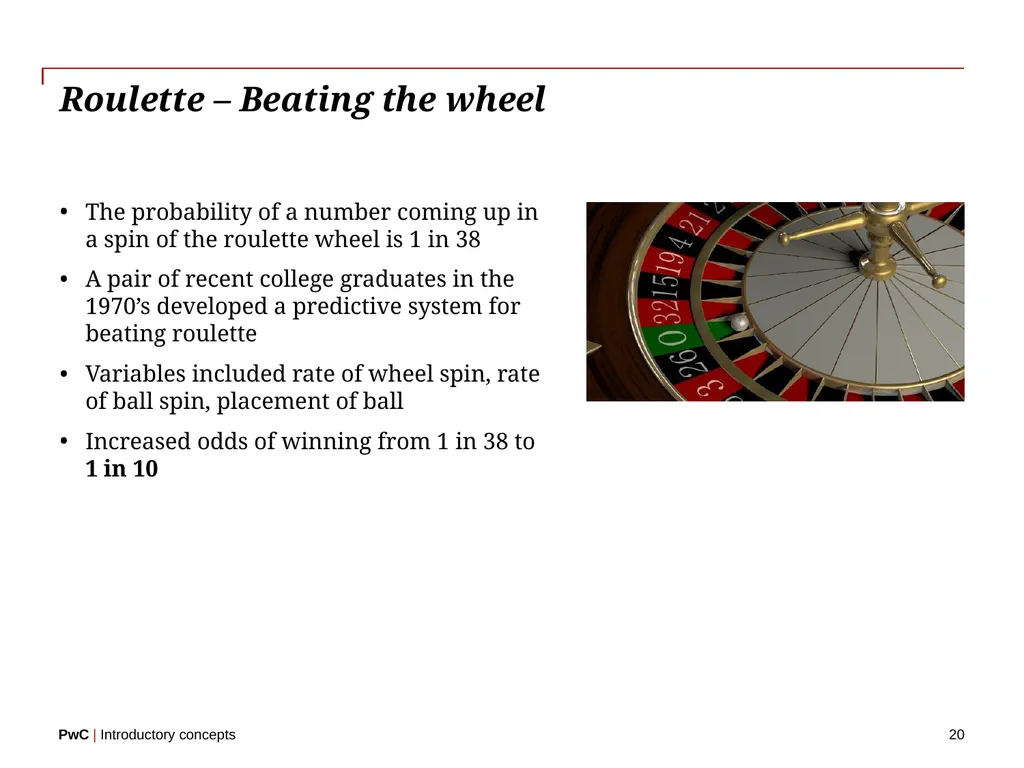
Roulette – Beating the wheel 20 The probability of a number coming up in a spin of the roulette wheel is 1 in 38
A pair of recent college graduates in the 1970’s developed a predictive system for beating roulette
Variables included rate of wheel spin, rate of ball spin, placement of ball
Increased odds of winning from 1 in 38 to 1 in 10<br>
A pair of recent college graduates in the 1970’s developed a predictive system for beating roulette
Variables included rate of wheel spin, rate of ball spin, placement of ball
Increased odds of winning from 1 in 38 to 1 in 10<br>
21
What are we trying to do with data? 21 Turn data into something useful!
Use data to make decisions and take actions<br>
Use data to make decisions and take actions<br>
22
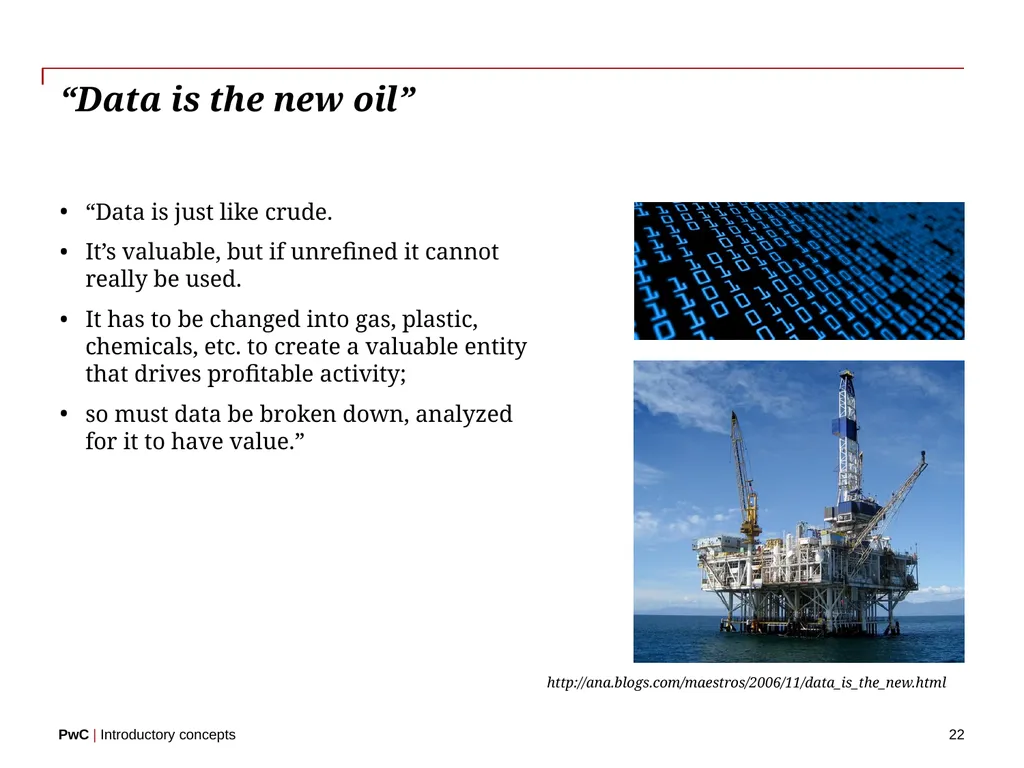
“Data is the new oil” 22 “Data is just like crude.
It’s valuable, but if unrefined it cannot really be used.
It has to be changed into gas, plastic, chemicals, etc. to create a valuable entity that drives profitable activity;
so must data be broken down, analyzed for it to have value.” http://ana.blogs.com/maestros/2006/11/data_is_the_new.html<br>
It’s valuable, but if unrefined it cannot really be used.
It has to be changed into gas, plastic, chemicals, etc. to create a valuable entity that drives profitable activity;
so must data be broken down, analyzed for it to have value.” http://ana.blogs.com/maestros/2006/11/data_is_the_new.html<br>
23
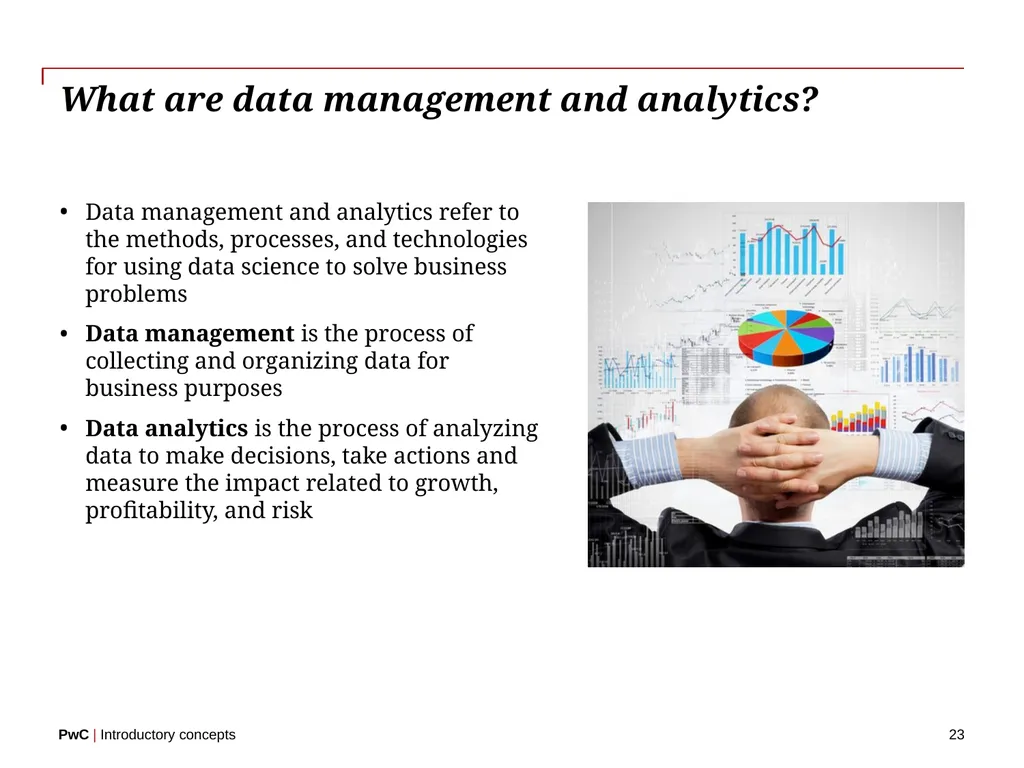
What are data management and analytics? 23 Data management and analytics refer to the methods, processes, and technologies for using data science to solve business problems
Data management is the process of collecting and organizing data for business purposes
Data analytics is the process of analyzing data to make decisions, take actions and measure the impact related to growth, profitability, and risk<br>
Data management is the process of collecting and organizing data for business purposes
Data analytics is the process of analyzing data to make decisions, take actions and measure the impact related to growth, profitability, and risk<br>
24
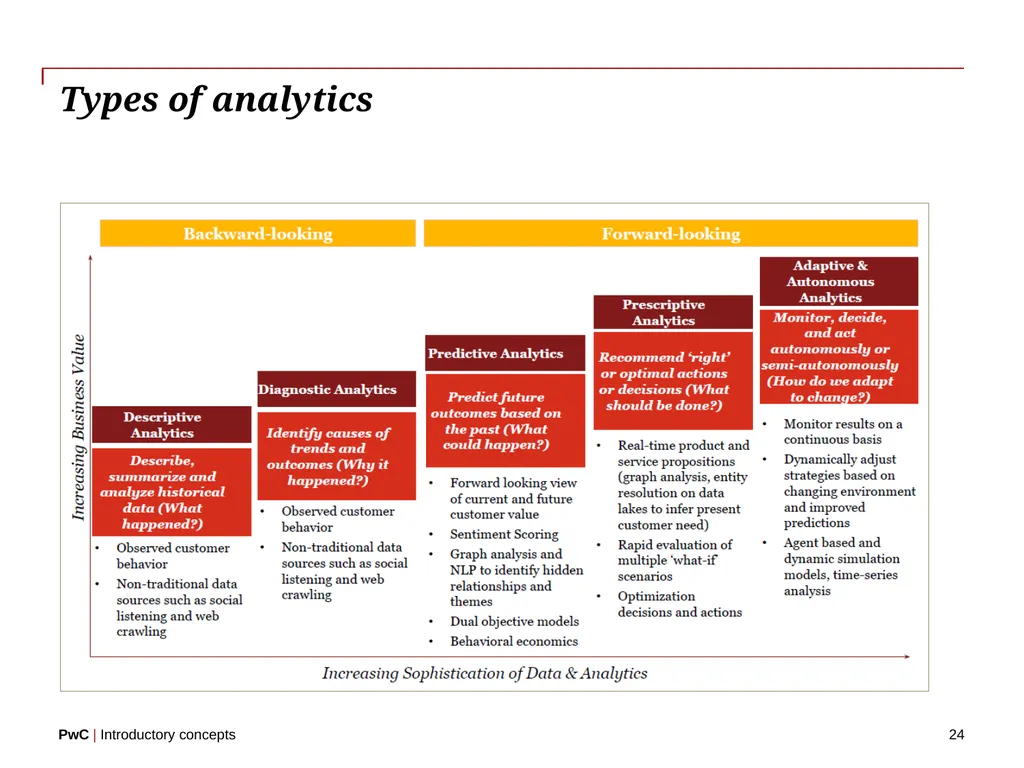
Types of analytics 24<br>
25
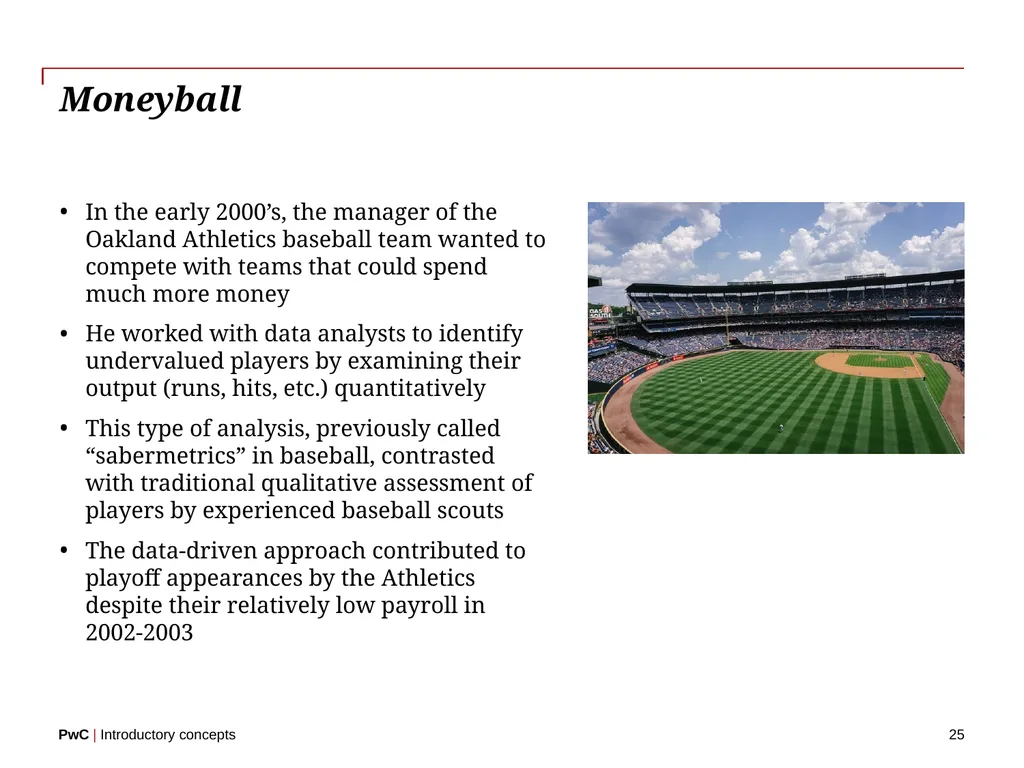
Moneyball 25 In the early 2000’s, the manager of the Oakland Athletics baseball team wanted to compete with teams that could spend much more money
He worked with data analysts to identify undervalued players by examining their output (runs, hits, etc.) quantitatively
This type of analysis, previously called “sabermetrics” in baseball, contrasted with traditional qualitative assessment of players by experienced baseball scouts
The data-driven approach contributed to playoff appearances by the Athletics despite their relatively low payroll in 2002-2003<br>
He worked with data analysts to identify undervalued players by examining their output (runs, hits, etc.) quantitatively
This type of analysis, previously called “sabermetrics” in baseball, contrasted with traditional qualitative assessment of players by experienced baseball scouts
The data-driven approach contributed to playoff appearances by the Athletics despite their relatively low payroll in 2002-2003<br>
26
Business value drivers 26 Revenue
Cost
Risk & Compliance<br>
Cost
Risk & Compliance<br>
27
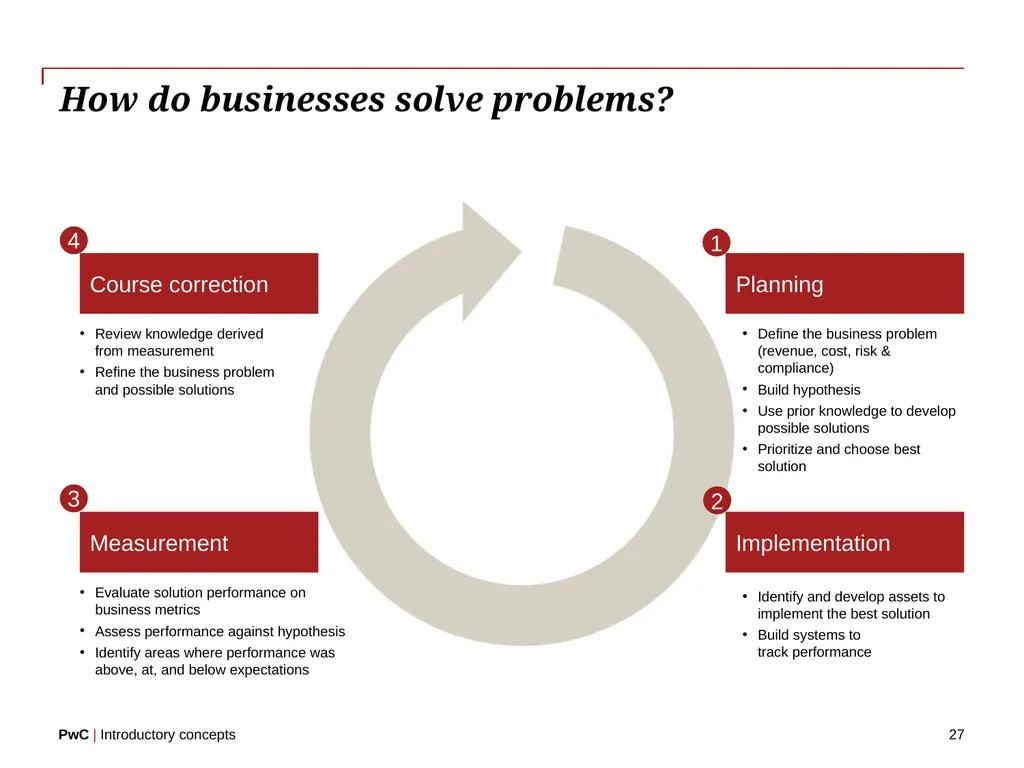
How do businesses solve problems? 27 Planning Implementation Measurement Course correction Define the business problem (revenue, cost, risk & compliance)
Build hypothesis
Use prior knowledge to develop possible solutions
Prioritize and choose best solution Identify and develop assets to implement the best solution
Build systems to track performance Evaluate solution performance on business metrics
Assess performance against hypothesis
Identify areas where performance was above, at, and below expectations Review knowledge derived from measurement
Refine the business problem and possible solutions 1 2 3 4<br>
Build hypothesis
Use prior knowledge to develop possible solutions
Prioritize and choose best solution Identify and develop assets to implement the best solution
Build systems to track performance Evaluate solution performance on business metrics
Assess performance against hypothesis
Identify areas where performance was above, at, and below expectations Review knowledge derived from measurement
Refine the business problem and possible solutions 1 2 3 4<br>
28
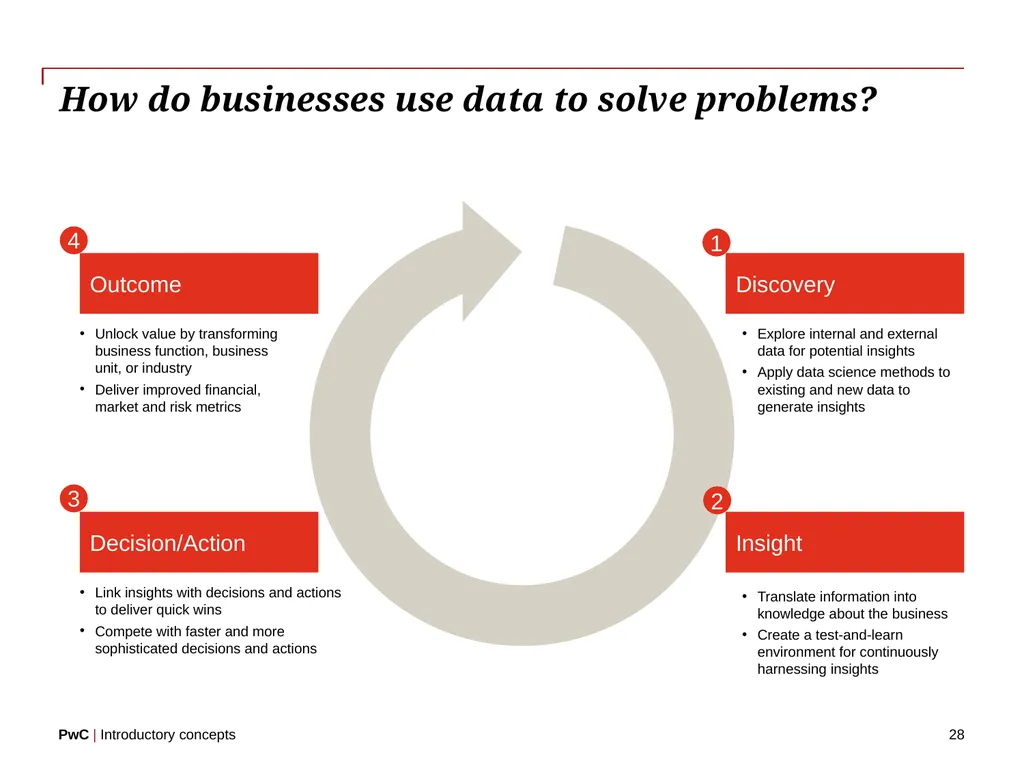
How do businesses use data to solve problems? 28 Discovery Insight Decision/Action Outcome Explore internal and external data for potential insights
Apply data science methods to existing and new data to generate insights Translate information into knowledge about the business
Create a test-and-learn environment for continuously harnessing insights Link insights with decisions and actions to deliver quick wins
Compete with faster and more sophisticated decisions and actions Unlock value by transforming business function, business unit, or industry
Deliver improved financial, market and risk metrics 1 2 3 4<br>
Apply data science methods to existing and new data to generate insights Translate information into knowledge about the business
Create a test-and-learn environment for continuously harnessing insights Link insights with decisions and actions to deliver quick wins
Compete with faster and more sophisticated decisions and actions Unlock value by transforming business function, business unit, or industry
Deliver improved financial, market and risk metrics 1 2 3 4<br>
29
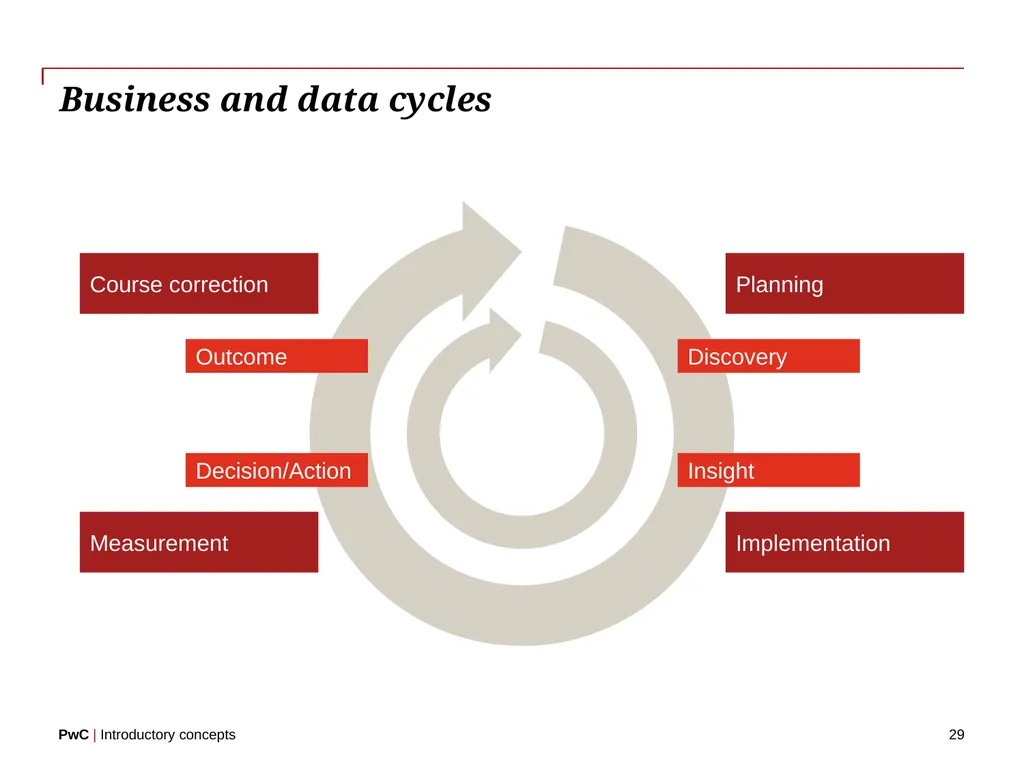
Business and data cycles 29 Planning Implementation Measurement Course correction Outcome Decision/Action Discovery Insight<br>
30
Exercise – Social media campaign 30 Scenario:
Kim Kardashian signed on as the official spokesperson for Cake It Up Makeup Company for one week
Kim agreed to use Twitter to promote the product, along with sponsored Tweets from the company
The hashtag “#CakeItUpKim” was created and is now trending
For discussion:
What kinds of questions would the marketing team have?
What data would be useful for answering those questions?<br>
Kim Kardashian signed on as the official spokesperson for Cake It Up Makeup Company for one week
Kim agreed to use Twitter to promote the product, along with sponsored Tweets from the company
The hashtag “#CakeItUpKim” was created and is now trending
For discussion:
What kinds of questions would the marketing team have?
What data would be useful for answering those questions?<br>
31
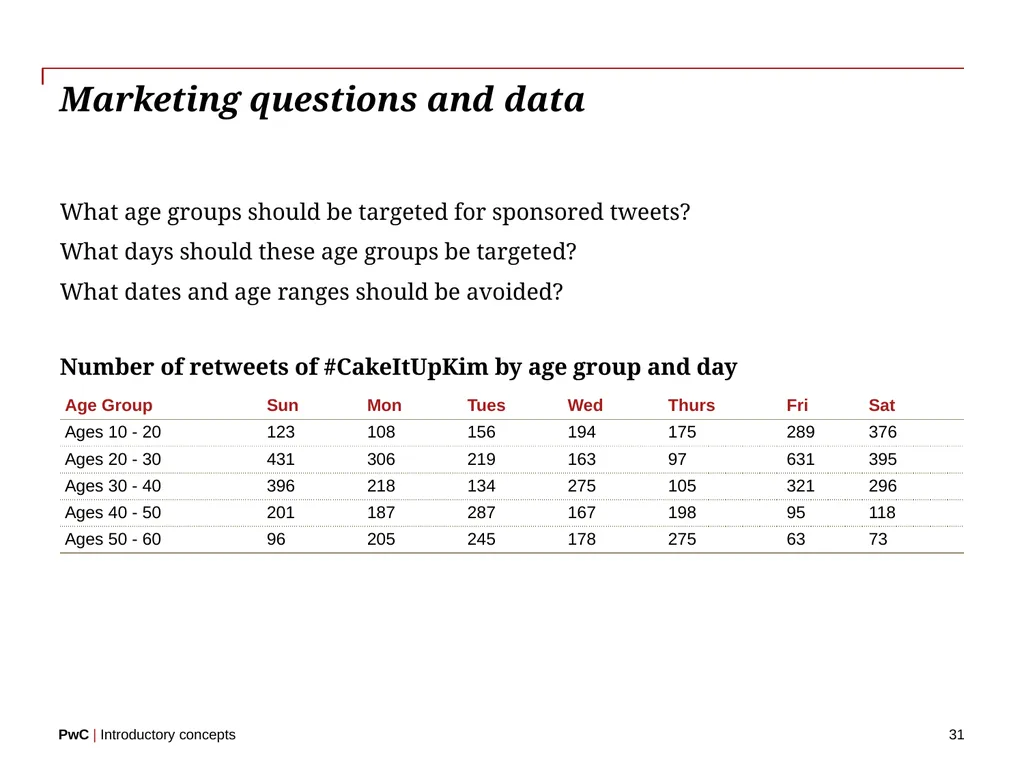
Marketing questions and data 31 What age groups should be targeted for sponsored tweets?
What days should these age groups be targeted?
What dates and age ranges should be avoided? Number of retweets of #CakeItUpKim by age group and day<br>
What days should these age groups be targeted?
What dates and age ranges should be avoided? Number of retweets of #CakeItUpKim by age group and day<br>
32
Fundamentals of data analysis 32<br>
33
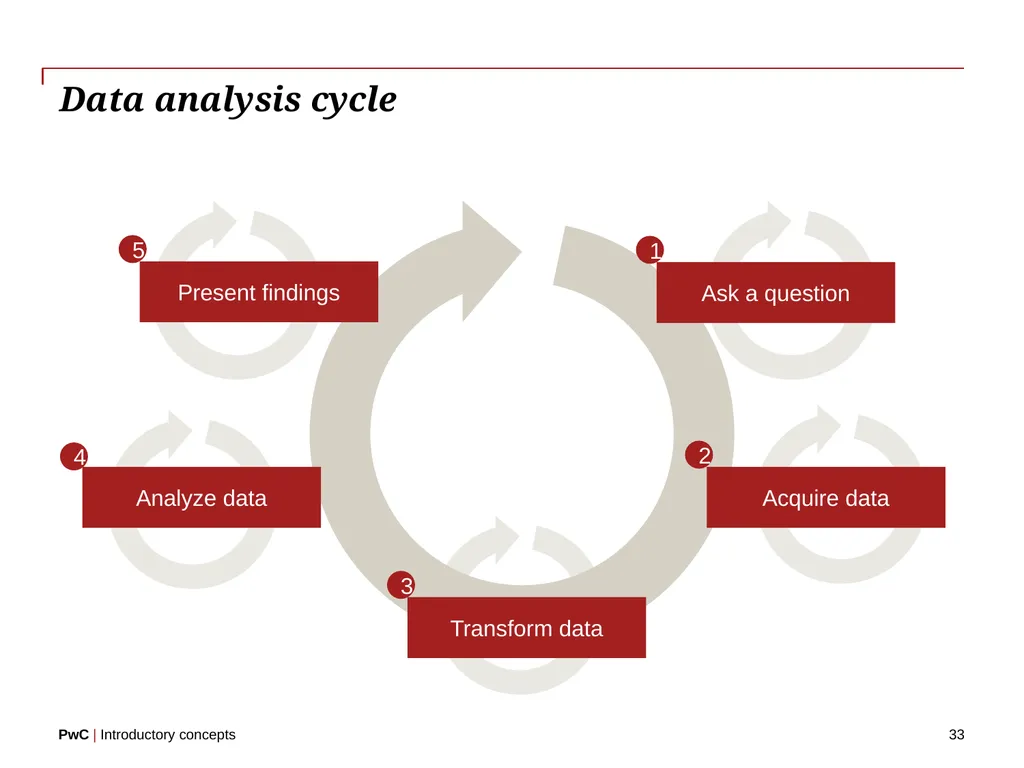
Data analysis cycle 33 Acquire data Analyze data Present findings Ask a question 1 2 Transform data 3 4 5<br>
34
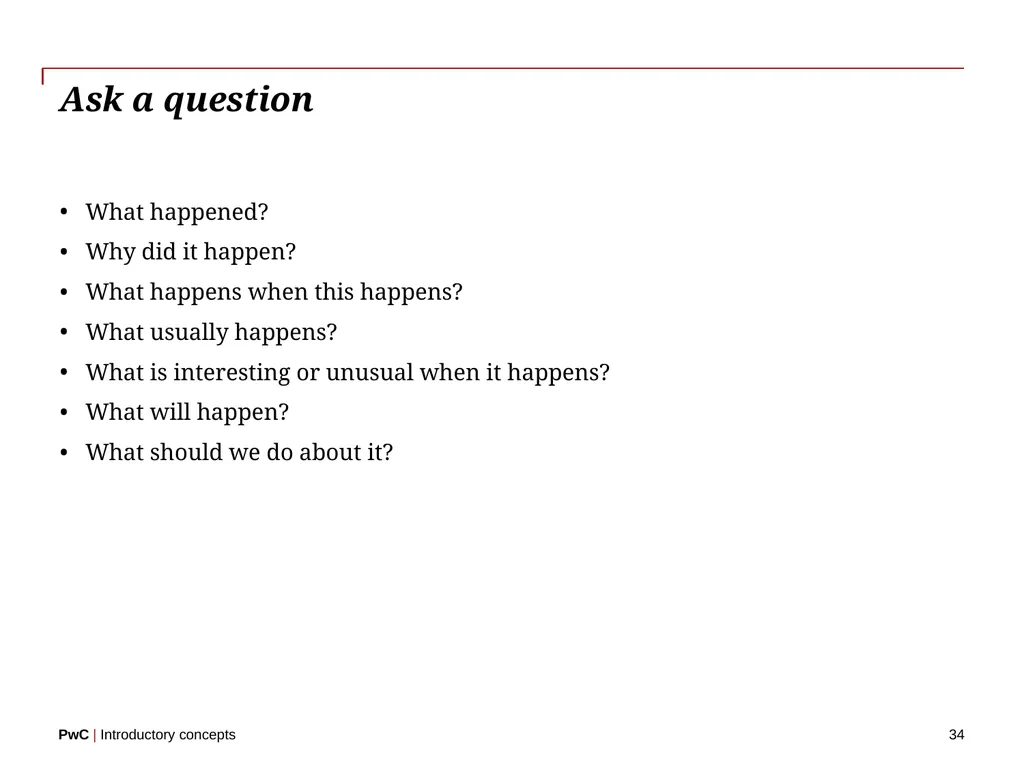
Ask a question 34 What happened?
Why did it happen?
What happens when this happens?
What usually happens?
What is interesting or unusual when it happens?
What will happen?
What should we do about it?<br>
Why did it happen?
What happens when this happens?
What usually happens?
What is interesting or unusual when it happens?
What will happen?
What should we do about it?<br>
35
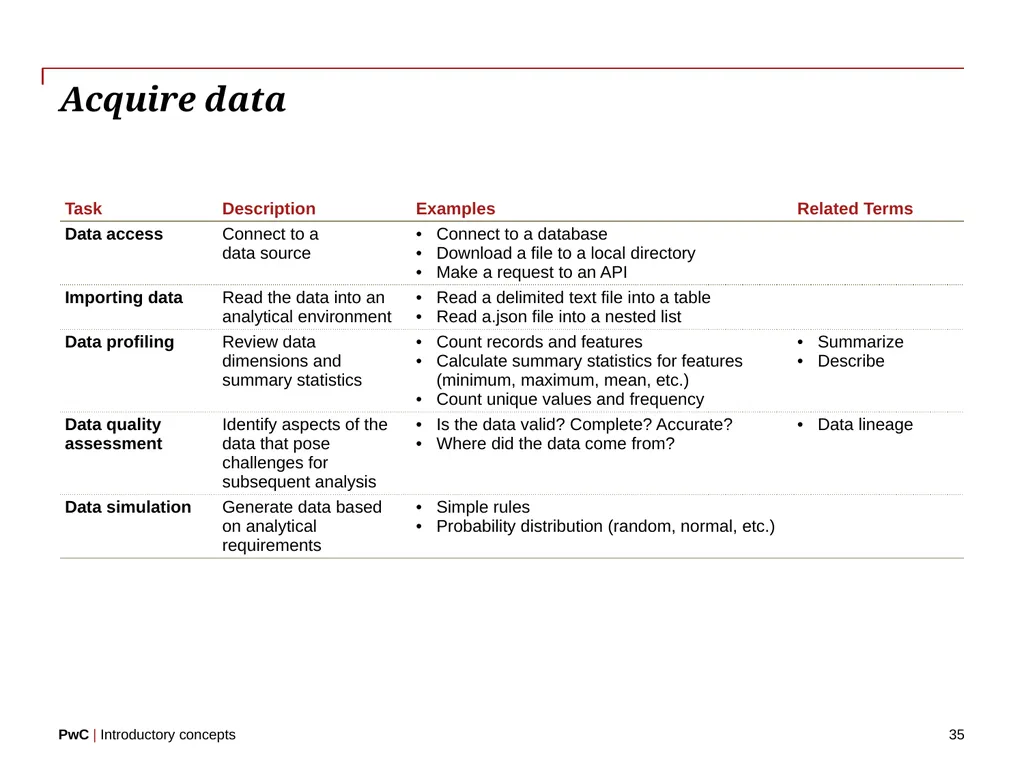
Acquire data 35<br>
36
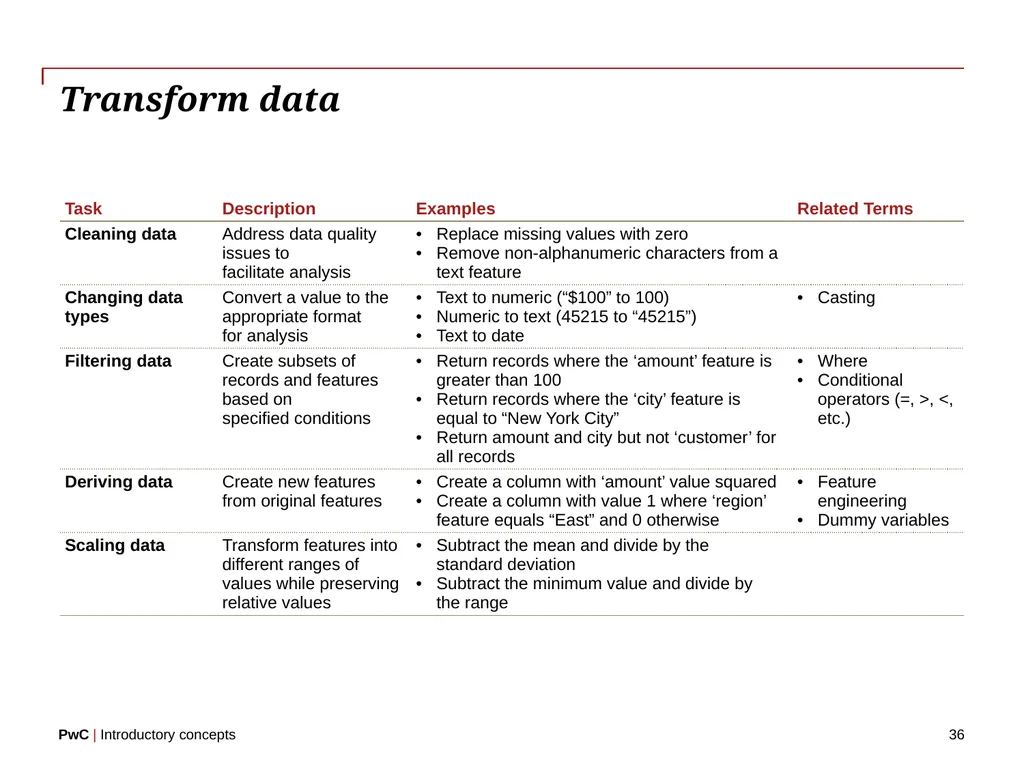
Transform data 36<br>
37
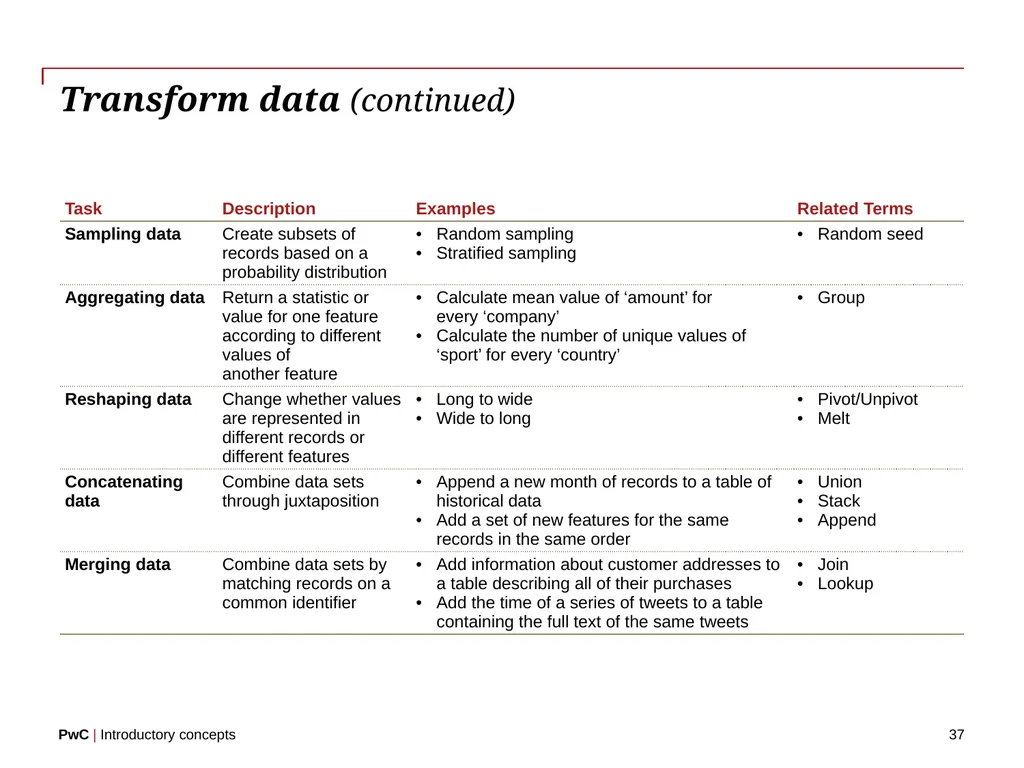
Transform data (continued) 37<br>
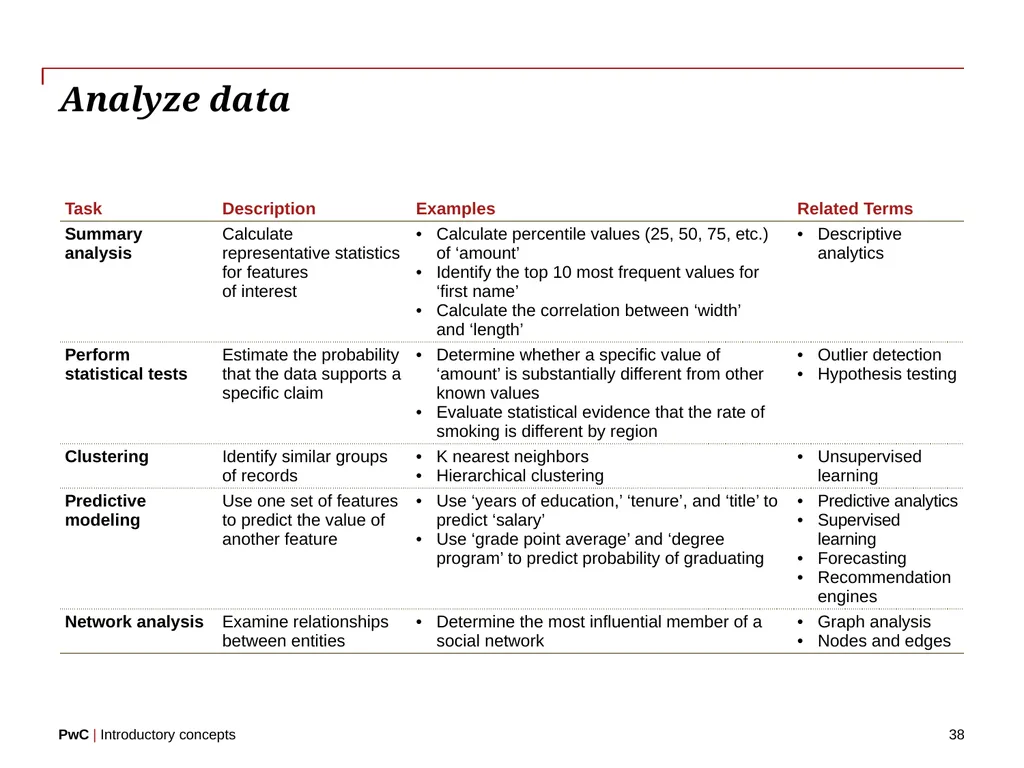
38
Analyze data 38<br>
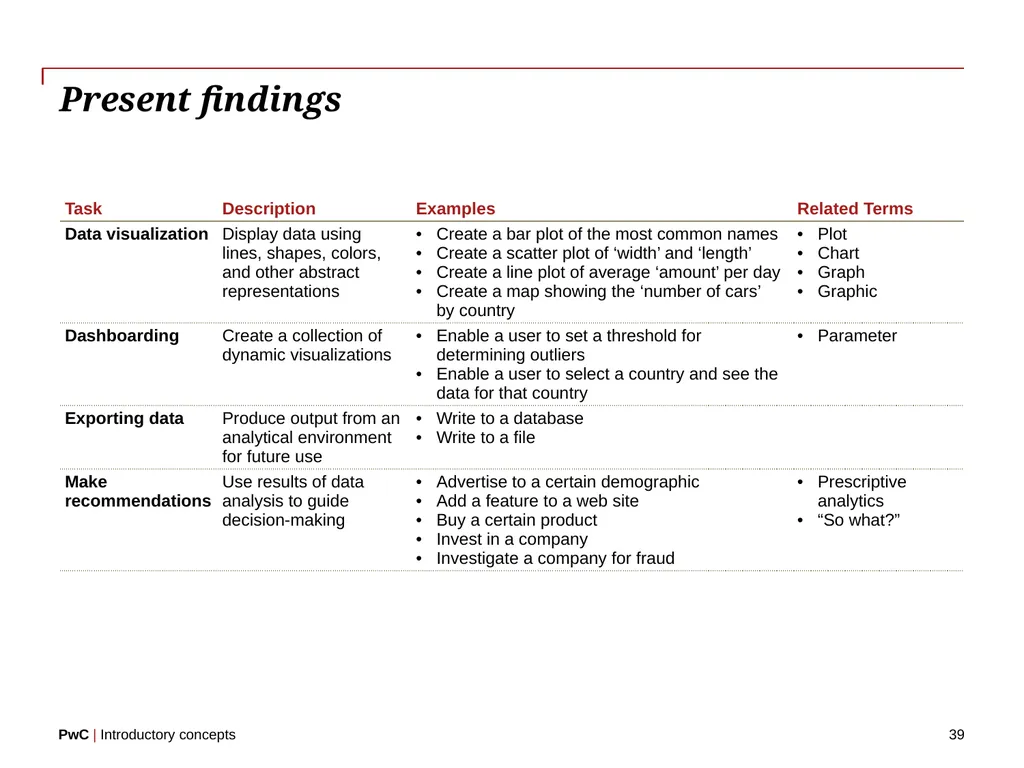
39
Present findings 39<br>
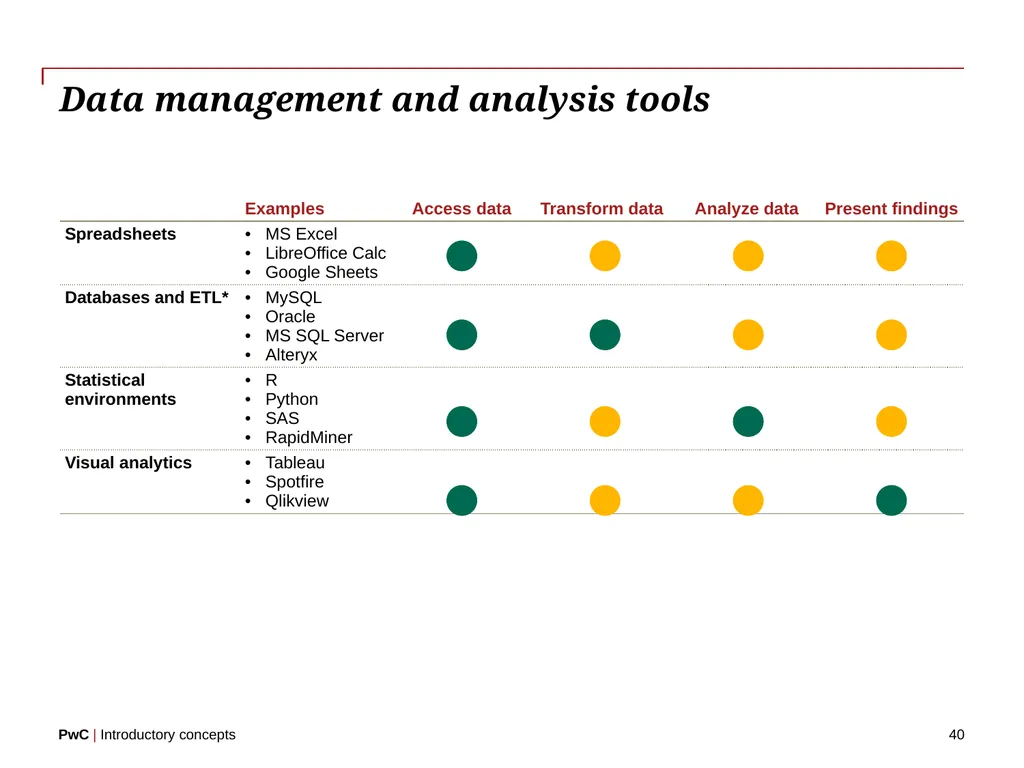
40
Data management and analysis tools 40<br>
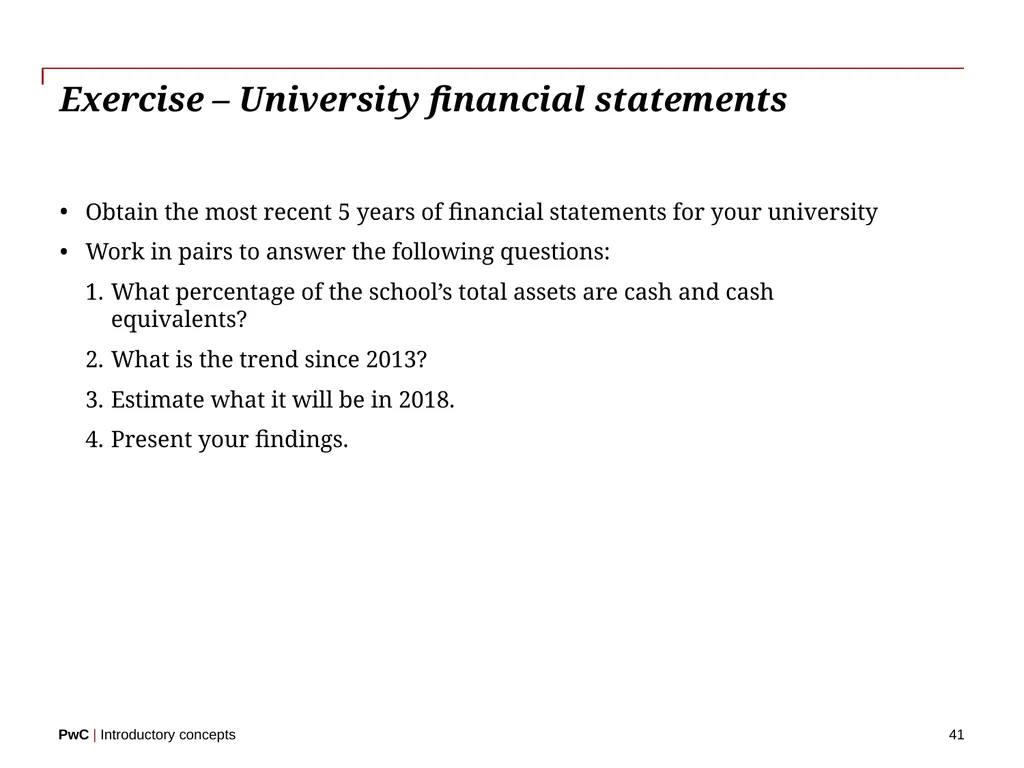
41
Exercise – University financial statements 41 Obtain the most recent 5 years of financial statements for your university
Work in pairs to answer the following questions:
What percentage of the school’s total assets are cash and cash equivalents?
What is the trend since 2013?
Estimate what it will be in 2018.
Present your findings.<br>
Work in pairs to answer the following questions:
What percentage of the school’s total assets are cash and cash equivalents?
What is the trend since 2013?
Estimate what it will be in 2018.
Present your findings.<br>
42
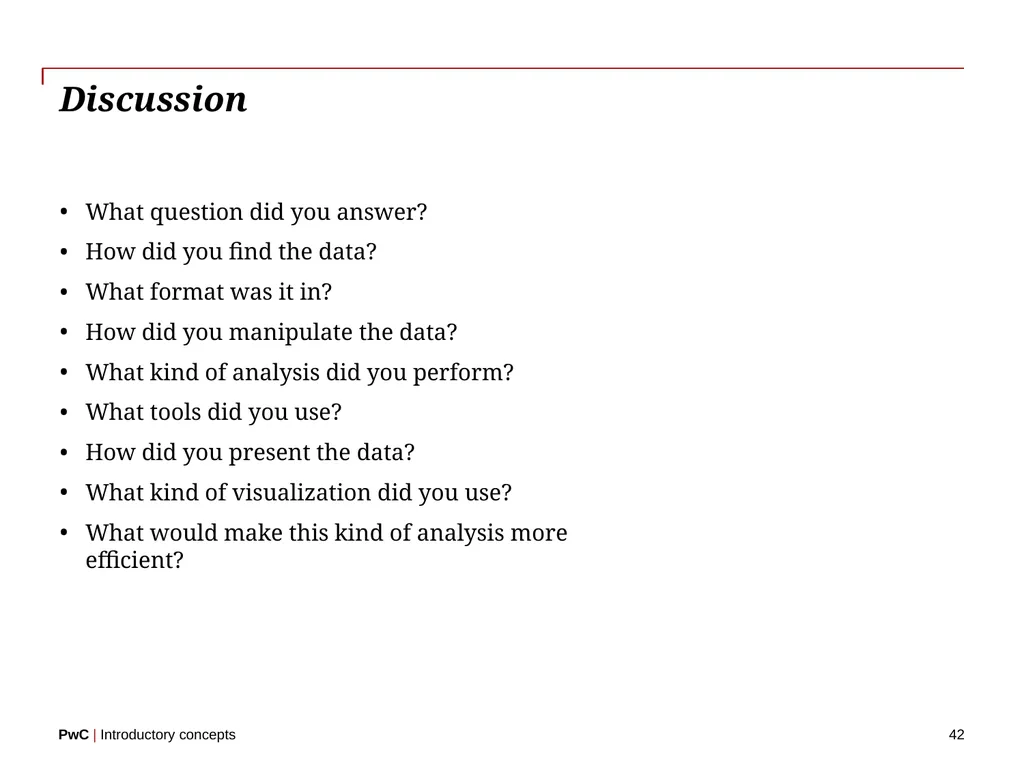
Discussion 42 What question did you answer?
How did you find the data?
What format was it in?
How did you manipulate the data?
What kind of analysis did you perform?
What tools did you use?
How did you present the data?
What kind of visualization did you use?
What would make this kind of analysis more efficient?<br>
How did you find the data?
What format was it in?
How did you manipulate the data?
What kind of analysis did you perform?
What tools did you use?
How did you present the data?
What kind of visualization did you use?
What would make this kind of analysis more efficient?<br>
43
Working with data 43<br>
44
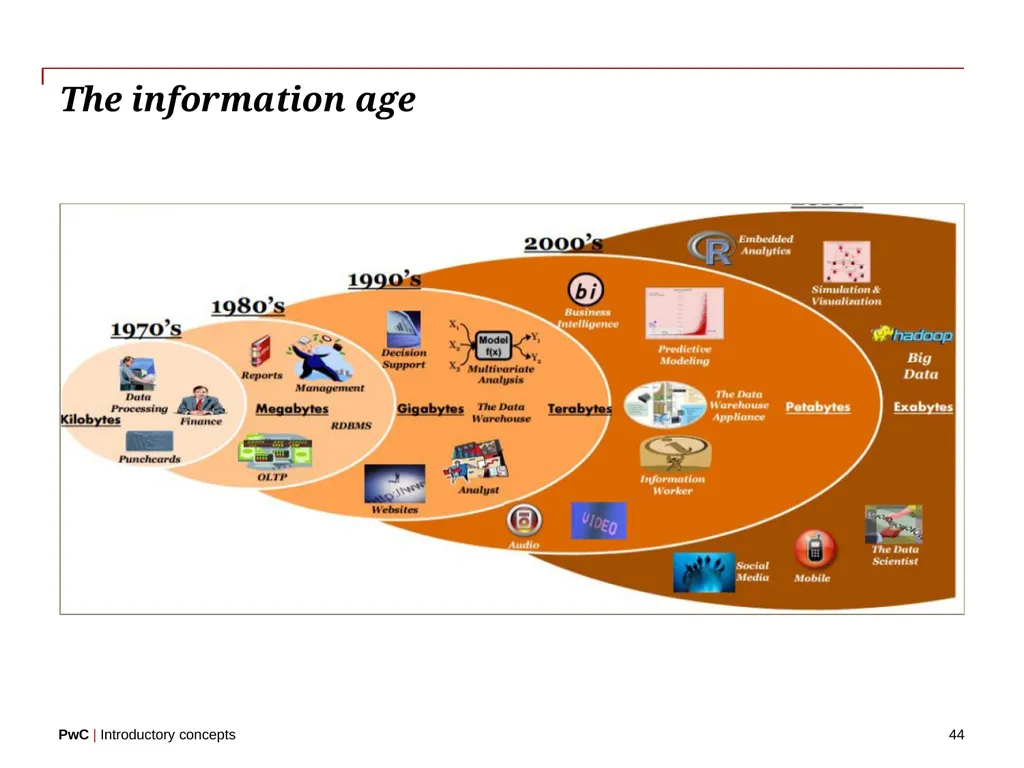
The information age 44<br>
45
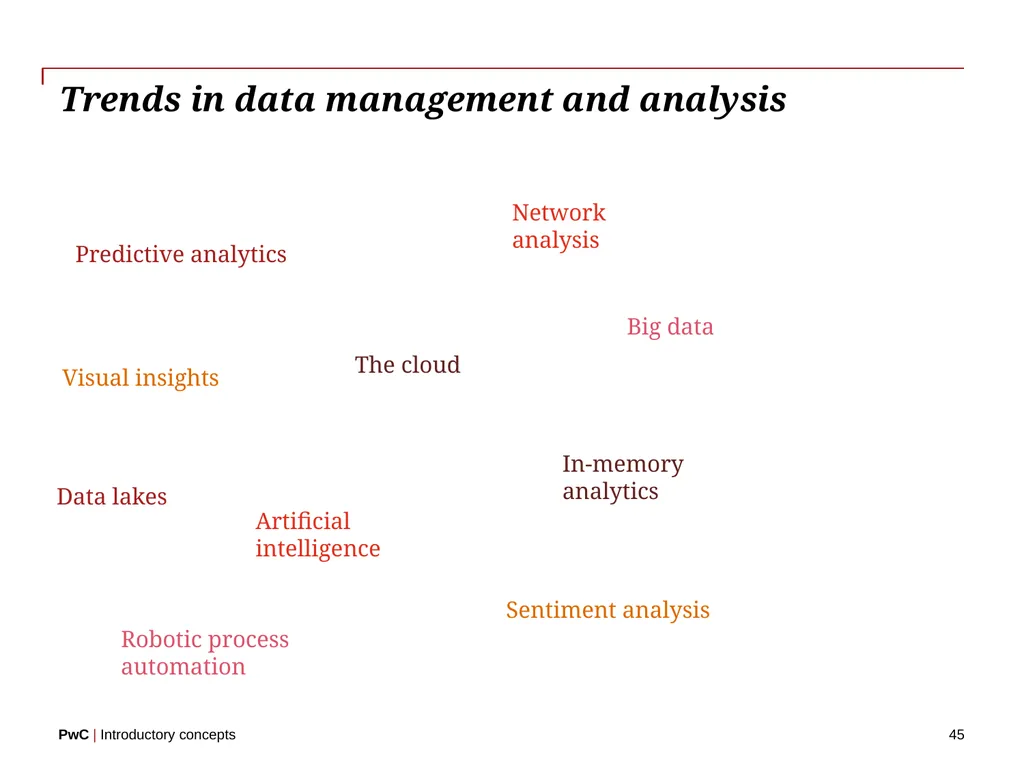
Trends in data management and analysis 45 Predictive analytics The cloud Data lakes In-memory analytics Network analysis Visual insights Artificial intelligence Big data Sentiment analysis Robotic process automation<br>
46
Exercise – Trends 46 How do you think data and analytics can solve problems in accounting and auditing?
Consider an emerging trend in data and analytics.
Discuss potential challenges and opportunities associated with this trend in your career.<br>
Consider an emerging trend in data and analytics.
Discuss potential challenges and opportunities associated with this trend in your career.<br>
47
Analytics is part of the job 47 In professional services firms, our work is now less about reliance on technology to retrieve and report on data, and more about analyzing the data and gaining insights
Clients ask us to take advantage of their investments in technology and apply sophisticated analytics tools to solve important problems
Communicating the meaning of data becomes even more crucial<br>
Clients ask us to take advantage of their investments in technology and apply sophisticated analytics tools to solve important problems
Communicating the meaning of data becomes even more crucial<br>
48
The data-driven audit 48 Automatically extract the data we need
Improve our ability to discern risk accurately and transparently
Automated testing and data validation
Stronger focus on data discovery and analysis
Improve efficiency and anticipate future problems
Give audit professionals more flexibility and opportunity to increase technical knowledge<br>
Improve our ability to discern risk accurately and transparently
Automated testing and data validation
Stronger focus on data discovery and analysis
Improve efficiency and anticipate future problems
Give audit professionals more flexibility and opportunity to increase technical knowledge<br>
49
Analytics for audit procedures 49 Testing assertions
Recalculations
Sampling
Scanning for unexpected activity
Testing correlations
Forecasting
… and more!<br>
Recalculations
Sampling
Scanning for unexpected activity
Testing correlations
Forecasting
… and more!<br>
50
Data and analytics roles 50 Become proficient in the languages of analytics to communicate effectively with specialists in data management and analytics
Innovate in your accounting and audit work to apply data management and analytics to improve your own work
Contribute best practices to make processes more efficient and provide greater assurance
Become the product or business owner for a commercial or internally developed solution
Become a data scientist… Computer Science Statistics Domain Knowledge Data Science Danger Zone! Traditional Research Machine Learning<br>
Innovate in your accounting and audit work to apply data management and analytics to improve your own work
Contribute best practices to make processes more efficient and provide greater assurance
Become the product or business owner for a commercial or internally developed solution
Become a data scientist… Computer Science Statistics Domain Knowledge Data Science Danger Zone! Traditional Research Machine Learning<br>
51
© 2018 PwC. All rights reserved. PwC refers to the US member firm or one of its subsidiaries or affiliates, and may sometimes refer to the PwC network. Each member firm is a separate legal entity. Please see www.pwc.com/structure for further details.<br>