PPT-Use of Technology for Better Data Visualization
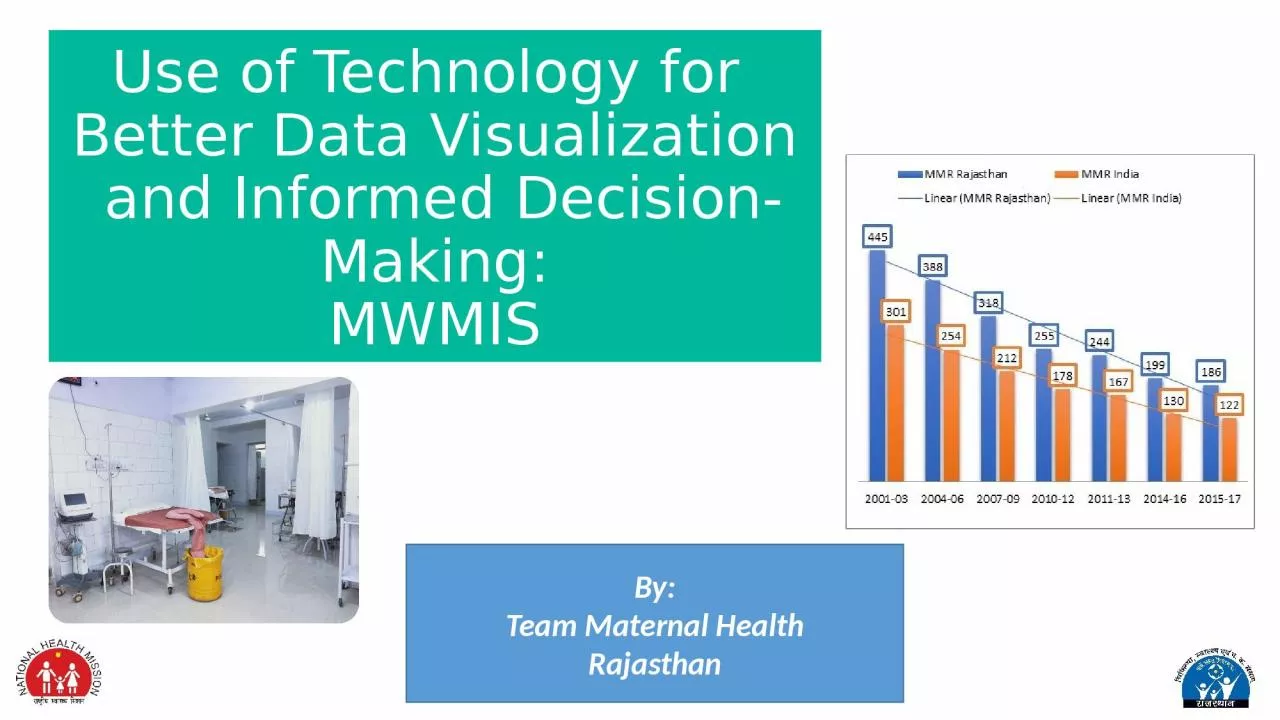
and Informed DecisionMaking MWMIS By Team Maternal Health Rajasthan Existing Paper Based System Enter primary detail in case Sheet Enter intra partum amp immediate
Download Presentation
"Use of Technology for Better Data Visualization" is the property of its rightful owner. Permission is granted to download and print materials on this website for personal, non-commercial use only, provided you retain all copyright notices. By downloading content from our website, you accept the terms of this agreement.
Presentation Transcript
Transcript not available.