/
Development of a public tool to model shoaling areas in the Navesink River, New Jersey Development of a public tool to model shoaling areas in the Navesink River, New Jersey

Development of a public tool to model shoaling areas in the Navesink River, New Jersey - PowerPoint Presentation

walsh
walsh . @walsh
Follow
64 views
Uploaded On 2024-01-13

Development of a public tool to model shoaling areas in the Navesink River, New Jersey - PPT Presentation

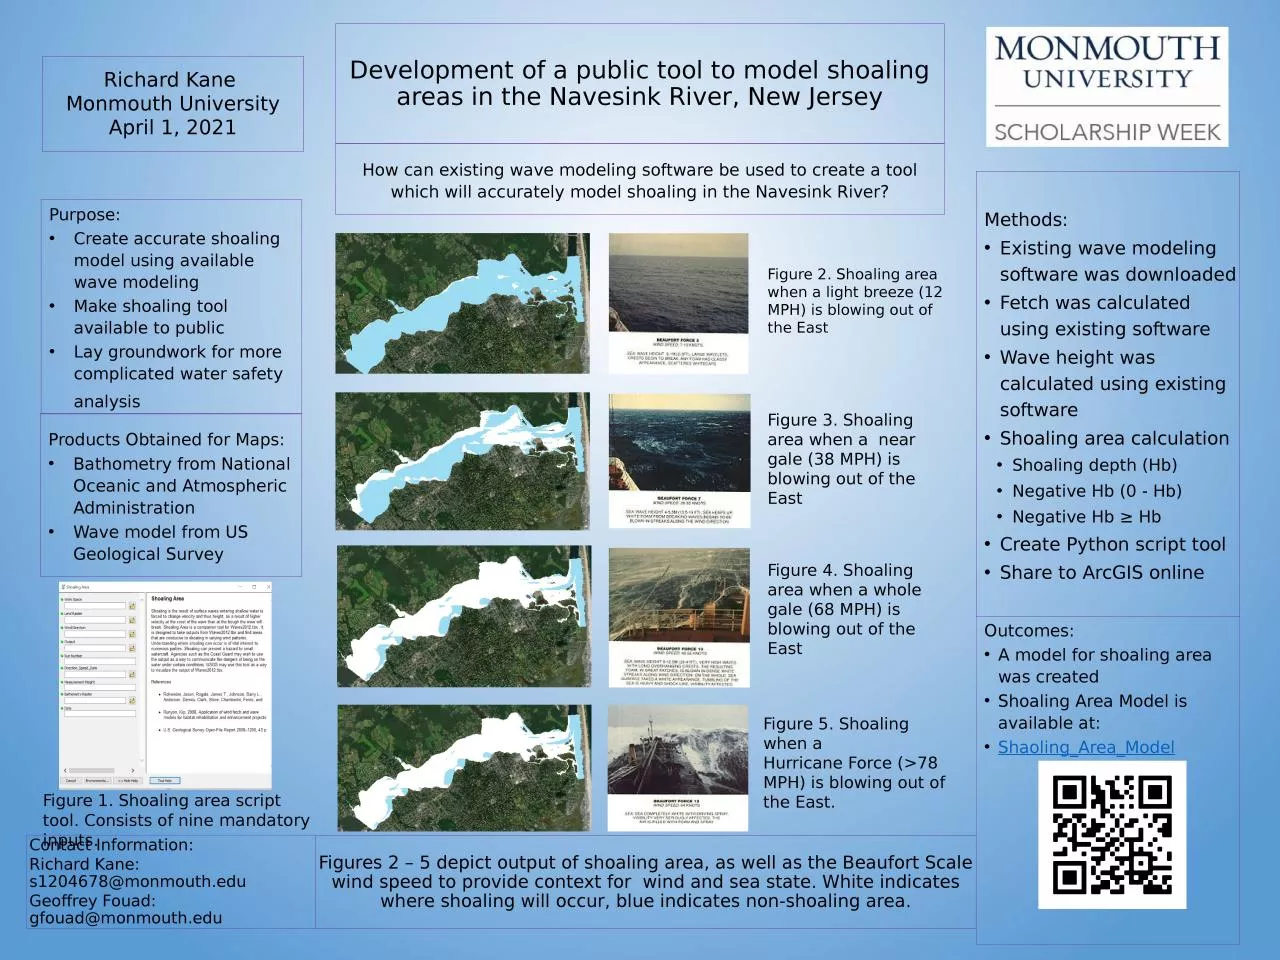
Richard Kane Monmouth University April 1 2021 Purpose Create accurate shoaling model using available wave modeling  Make shoaling tool available to public  Lay groundwork for more complicated water safety analysis   ID: 1039830

area shoaling tool model shoaling area model tool existing mph blowing figure monmouth east wave calculated wind negative modeling

Share:

Link:

Embed:

Download Presentation from below link

Download Presentation The PPT/PDF document "Development of a public tool to model sh..." is the property of its rightful owner. Permission is granted to download and print the materials on this web site for personal, non-commercial use only, and to display it on your personal computer provided you do not modify the materials and that you retain all copyright notices contained in the materials. By downloading content from our website, you accept the terms of this agreement.


Presentation Transcript

1. Development of a public tool to model shoaling areas in the Navesink River, New JerseyRichard Kane Monmouth UniversityApril 1, 2021Purpose:Create accurate shoaling model using available wave modeling Make shoaling tool available to public Lay groundwork for more complicated water safety analysis    How can existing wave modeling software be used to create a tool which will accurately model shoaling in the Navesink River?Methods:Existing wave modeling software was downloadedFetch was calculated using existing softwareWave height was calculated using existing software Shoaling area calculationShoaling depth (Hb)Negative Hb (0 - Hb)Negative Hb ≥ HbCreate Python script tool Share to ArcGIS online Products Obtained for Maps:Bathometry from National Oceanic and Atmospheric AdministrationWave model from US Geological SurveyOutcomes:A model for shoaling area was createdShoaling Area Model is available at:Shaoling_Area_ModelFigure 2. Shoaling area when a light breeze (12 MPH) is blowing out of the East Figure 3. Shoaling area when a near gale (38 MPH) is blowing out of the EastFigure 4. Shoaling area when a whole gale (68 MPH) is blowing out of the East Figure 5. Shoaling when a Hurricane Force (>78 MPH) is blowing out of the East. Figure 1. Shoaling area script tool. Consists of nine mandatory inputs. Figures 2 – 5 depict output of shoaling area, as well as the Beaufort Scale wind speed to provide context for  wind and sea state. White indicates where shoaling will occur, blue indicates non-shoaling area.Contact Information:Richard Kane: s1204678@monmouth.eduGeoffrey Fouad: gfouad@monmouth.edu