/
Delaware School Survey Data Understand, Interpret, Use & Share Delaware School Survey Data Understand, Interpret, Use & Share

Delaware School Survey Data Understand, Interpret, Use & Share - PowerPoint Presentation

yoshiko-marsland
yoshiko-marsland . @yoshiko-marsland
Follow
343 views
Uploaded On 2019-11-01

Delaware School Survey Data Understand, Interpret, Use & Share - PPT Presentation

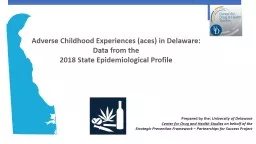
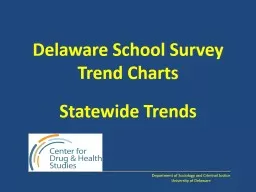
Delaware School Survey Data Understand Interpret Use amp Share Delaware Positive Behavior Support Project May 13 2019 wwwdelawarepbsorg Data Report Overview Data Report Structure amp Coding ID: 761907

larger scores school data scores larger data school report difference staff amp table average item survey year student differences

Share:

Link:

Embed:

Download Presentation from below link

Download Presentation The PPT/PDF document "Delaware School Survey Data Understand, ..." is the property of its rightful owner. Permission is granted to download and print the materials on this web site for personal, non-commercial use only, and to display it on your personal computer provided you do not modify the materials and that you retain all copyright notices contained in the materials. By downloading content from our website, you accept the terms of this agreement.


Presentation Transcript

Delaware School Survey Data Understand, Interpret, Use & Share Delaware Positive Behavior Support Project May 13, 2019 www.delawarepbs.org

Data Report Overview

Data Report Structure & Coding Table Number Codes 1 = School Climate Subscales 2 = Techniques Subscales 3 = Bullying Subscales Data4 = Engagement Subscales 5 = Social Emotional Competencies Scale Response Codes Table 1, 2, 4 : 1 = Disagree A Lot, 2 = Disagree, 3 = Agree, 4 = Agree A Lot Table 3 : 1 = Never, 2 = Less than once a month , 3 = Once or Twice/Month , 4 = Once/Week , 5 = Several Times/Week , 6 = Everyday Table 5 : 1 = Not like me at all, 2 = Not much like me, 3 = Somewhat like me, 4 = Very much like me

Data Report Structure & Coding Table Letter Codes a = Standard Scores (SS) b = Average Item Scores (AIS) c = Individual Items % ResponseSTUDENT only:(1) = Race & Gender Breakdown(2) = Grade Level Breakdown Symbol Code* A higher score represents an unfavorable response to items on the Bullying School-Wide subscale and the Use of Punitive Techniques subscale.

Standard Scores Based on grade-level norms (typically elementary, middle school, high school) or on specific grades for student survey (3-12). Data Report – Types of Scores

Average Item Scores Particularly meaningful when scores tend be very high across all schools Most appropriate score for comparing scores from year to year.

Frequency Scores Given a subscale score, what specific items caused the score to be low or high?

Color Coding Data Report Features

Multi-year Graph (average item) Staff Graph 1b School Climate

A Note on “Significant Differences” Is the difference in scores (within subscales or from year to year) “significant”? Practical significance: is the difference meaningful for our school? Statistical significance: 95% chance that the difference in scores is not due to chance*Statistical significance does not imply practical importanceSchools should have little concern about significant differences when all of their scores are fairly high (e.g., above 3.3)Schools should be less concerned about a difference from year to year than about general pattern in scores over multiple years

How to determine significant differences Table & guidance included on the last page of all Interpretation Worksheets (Student, Staff, Home) Helps determine if differences in average item scores NOT standard scores are likely to be statistically significantTable notes approximate size differences needed for statistical significanceApproximate Difference in Average Item Scores (1.0-4.0) Needed to be Statistically Significant Size of Sample (N)Approximate Difference Needed 15.38 or larger 20 .33 or larger 30 .29 or larger 40 .26 or larger 50 .20 or larger 60 .19 or larger 70 .17 or larger 80 .16 or larger 90 .15 or larger 100 .14 or larger 120 .13 or larger 140 .12 or larger 160 .11 or larger 200 .10 or larger 240 .09 or larger 310 .08 or larger 400 .07 or larger 540 .06 or larger 780 .05 or larger

How to use the table 1. Look at the number of respondents for the two given scores (i.e., the sample size, or N). If the number is different, use the lower N or an average of the two (e.g., 120 students completed the Teacher-Student subscale and 80 completed the Student-Student subscale, use 80 or 100, with 80 being more conservative).2. Find the number in Column 1 that is closest to your N. 3. Find the number in Column 2 (Approximate Difference Needed) that aligns with your N. This difference is the minimal difference needed for statistical significance. For example, if you have 50 students, you need a difference of .20 or larger to conclude that there is a 95% chance that the difference is not an error and is statistically significant.

Interpretation Worksheets & Action Plan Overview

Interpretation Worksheet Structure Worksheet per survey population (Student, Staff, Home) Guides you through each survey scale (School Climate, Techniques, Bullying, Engagement, Social Emotional Competencies) Guides you through 3 types of scores plus graphsInformation gathered then used to complete action planning template

When interpreting standard and average item scores for your school: First, focus on Total Scores Next, check for differences within and between groups Student Survey: Grade, Race, Gender Teacher Survey: Teacher vs. Staff Home Survey: RaceConsider strengths, concerns, general notes such as significant differences School Climate Workshop, 5/7/13Interpretation Worksheet Structure

Order of Review Prompts per Scale Multi-Year Graphs Average Item Scores Individual Item Percent Responses Standard Scores

Prompts to examine total scores and scores by subgroups. Check out utility of data and prompting questions. Look for Table # referenced in section directions “ Table 1b ”You are looking at Average Item Scores(AIS)Prompts to examine total scores and scores by subgroups.

To note your “sizeable” strengths and your relative strengths. To note your “considerable concerns” and your relative concerns.

Pg.1 of Staff Report Where and what are the “sizeable” strengths for YOUR school?

Pg.1 of Staff Report Here are your sizeable strengths!

Pg.1 of Staff Report Now, w here and what are your “considerable” concerns?

Pg.1 of Staff Report

Remember to Share! Don’t keep data a secret.

Data Sharing Templates for Staff & Families PowerPoints Include: Overview of school c limate Summary of survey structure & report informationSchool results templates & samplesDiscussion & planning promptsResources

PowerPoint Data Sharing Templates Feel free to edit the templates to meet your presentation needs. It’s okay to cut and add slides. Read the “notes” section for each slide to help you finalize what goes where in your presentation Using screen shots from your DSCS report or interpretation guide notes to save time.Consider giving staff time immediately after your presentation to:brainstorm ways to improve any areas of concern (Action Planning)share strategies that they feel help to address any identified areas of strength or concerns

Don’t forget to CELEBRATE your good news! Even when you get data that isn’t what you were looking for, your data gives you important information to guide next steps in promoting positive climate in your school.

Recommended next steps for today: Review student report (if applicable) Your next steps in the coming weeks: Determine how and when to share! Start action planning

Data Review