/
For each of these questions: For each of these questions:

For each of these questions: - PowerPoint Presentation

yoshiko-marsland
yoshiko-marsland . @yoshiko-marsland
Follow
342 views
Uploaded On 2020-01-05

For each of these questions: - PPT Presentation

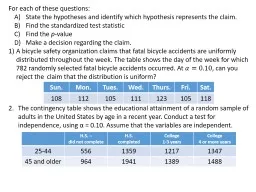
For each of these questions A State the hypotheses and identify which hypothesis represents the claim B Find the standardized test statistic C Find the p value D Make a decision regarding the claim ID: 772050

week bicycle claim fatal bicycle week fatal claim uniform distribution accidents table test reject day matrix shows 782 variables

Share:

Link:

Embed:

Download Presentation from below link

Download Presentation The PPT/PDF document "For each of these questions:" is the property of its rightful owner. Permission is granted to download and print the materials on this web site for personal, non-commercial use only, and to display it on your personal computer provided you do not modify the materials and that you retain all copyright notices contained in the materials. By downloading content from our website, you accept the terms of this agreement.


Presentation Transcript

For each of these questions: A) State the hypotheses and identify which hypothesis represents the claim. B) Find the standardized test statistic C) Find the p-value D) Make a decision regarding the claim.1) A bicycle safety organization claims that fatal bicycle accidents are uniformly distributed throughout the week. The table shows the day of the week for which 782 randomly selected fatal bicycle accidents occurred. At , can you reject the claim that the distribution is uniform?The contingency table shows the educational attainment of a random sample of adults in the United States by age in a recent year. Conduct a test for independence, using α = 0.10. Assume that the variables are independent.   H.S. – did not completeH.S. completedCollege 1-3 yearsCollege 4 or more years25-4455613591217134745 and older964194113891488 Sun. Mon. Tues. Wed. Thurs. Fri. Sat. 108 112 105 111 123 105 118

1) A bicycle safety organization claims that fatal bicycle accidents are uniformly distributed throughout the week. The table shows the day of the week for which 782 randomly selected fatal bicycle accidents occurred. At , can you reject the claim that the distribution is uniform?  Sun. Mon.Tues.Wed.Thurs.Fri.Sat.108112105111123105118SOLUTION:The distribution of fatal bicycle deaths by day of the week is uniform.The distribution of fatal bicycle deaths by day of the week is not uniform. STAT - Edit L1 holds the claimed percentages Since the claim is that the distribution is uniform, ALL the percentages will be equal to each other. There are 7 categories, so divide 1 by 7 to get the claimed percentage. Type “1/7” into L1 7 times (one for each category).  

1) A bicycle safety organization claims that fatal bicycle accidents are uniformly distributed throughout the week. The table shows the day of the week for which 782 randomly selected fatal bicycle accidents occurred. At , can you reject the claim that the distribution is uniform?  Sun. Mon.Tues.Wed.Thurs.Fri.Sat.108112105111123105118SOLUTION:The distribution of fatal bicycle deaths by day of the week is uniform.The distribution of fatal bicycle deaths by day of the week is not uniform. STAT - Edit L2 holds the observed frequencies Enter the numbers shown in the table into L2 L3 holds the expected values Highlight L3 and type "L1*782", since n = 782. L3 should have 111.714 in all 7 rows.  

1) A bicycle safety organization claims that fatal bicycle accidents are uniformly distributed throughout the week. The table shows the day of the week for which 782 randomly selected fatal bicycle accidents occurred. At , can you reject the claim that the distribution is uniform?  Sun. Mon.Tues.Wed.Thurs.Fri.Sat.108112105111123105118SOLUTION: STAT - TEST - D Observed is in L2, Expected is in L3, Degrees of Freedom (df) = 6 (k – 1, where k is the number of categories) (Standardized test statistic) Since , we fail to reject the null. This means that at the 10% significance level, there is not enough evidence to reject the claim that the distribution of fatal bicycle accidents throughout the week is uniform.  

The contingency table shows the educational attainment of a random sample of adults in the United States by age in a recent year. Conduct a test for independence, using α = 0.10. Assume that the variables are independent. A) The variables years of education attained and age are independent. The variables years of education attained and age are dependent. The null hypothesis is the claim.2nd Matrix, Edit 1 (A) Create a 2 x 4 matrix and enter the numbers from the table into that matrix. Stat-Test-C Matrix A is the Observed Matrix B is the Expected. Access Matrix B (2nd Matrix Edit 2) and confirm that all cell values are > 5. H.S. – did not completeH.S. completedCollege 1-3 years College 4 or more years 25-44 556 1359 1217 1347 45 and older 964 1941 1389 1488

The contingency table shows the educational attainment of a random sample of adults in the United States by age in a recent year. Conduct a test for independence, using α = 0.10. Assume that the variables are independent. The standardized test statistic is = 66.182C) The p-value is 2.877E-14 D) Since p < α, we reject the null. Since the null is the claim, we also reject the claim.This means that the variables are dependent, or related to each other. H.S. – did not completeH.S. completedCollege 1-3 yearsCollege 4 or more years25-4455613591217134745 and older 964 1941 1389 1488