/
The Economic Outlook The Economic Outlook

The Economic Outlook - PowerPoint Presentation

yoshiko-marsland
yoshiko-marsland . @yoshiko-marsland
Follow
343 views
Uploaded On 2019-11-22

The Economic Outlook - PPT Presentation

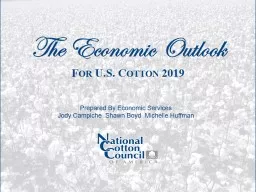
The Economic Outlook For US Cotton 2019 Prepared By Economic Services Jody Campiche Shawn Boyd Michelle Huffman 2018 Year in Review Uncertainty in the global economy and the world cotton market due to the USChina trade tensions ID: 766698

change 2019 cotton 2018 2019 change 2018 cotton production bales acreage intended stocks total china due actual world million

Share:

Link:

Embed:

Download Presentation from below link

Download Presentation The PPT/PDF document "The Economic Outlook" is the property of its rightful owner. Permission is granted to download and print the materials on this web site for personal, non-commercial use only, and to display it on your personal computer provided you do not modify the materials and that you retain all copyright notices contained in the materials. By downloading content from our website, you accept the terms of this agreement.


Presentation Transcript

The Economic OutlookFor U.S. Cotton 2019 Prepared By Economic ServicesJody Campiche Shawn Boyd Michelle Huffman

2018 – Year in ReviewUncertainty in the global economy and the world cotton market due to the U.S.-China trade tensionsSlowdown in U.S., China, and world economiesLower U.S. and world production Further reduction in Chinese stocks

2018 U.S. Cotton Production 2017 2018 Change Southeast 4,592 4,265 -327 Mid-South 4,311 4,605 +294 Southwest 10,487 7,992 -2,495 West 833 734 -99 All Upland 20,223 17,596 -2,627 ALL ELS 700 794 +94 All Cotton 20,923 18,390 -2,533

U.S. Balance Sheet 17/18 18/19 Change Production 20.92 18.39 -2.53 Mill Use3.233.20-0.03Exports15.8515.00-0.85Stocks4.304.300Stocks/Use22.5%23.6%+1.1% Million Bales

NCC Acreage SurveyDistributed on Dec 15Responses collected through mid-JanuaryAsked for acres of upland cotton, ELS cotton, corn, soybeans, wheat, other crops in ‘18 and intentions for ’19

Pre-Planting Market Signals Cotton Corn Soybeans Cot/Corn Cot/Soy 2019 74.28¢ $4.00$9.4618.67.9201876.27¢$3.95$10.1519.37.5201773.53¢$3.91$10.0818.8 7.3 2016 59.68¢ $3.84 $8.9215.56.7201565.00¢$4.13$9.7215.76.7201478.57¢$4.66$11.4416.96.9 2019: avg Nov 19’/Dec 19’ futures 12/15/18 – 01/15/19, 2013-2018: avg Jan-Mar Nov/Dec contract price

Pre-Planting Market Signals

U.S. Drought Monitor February 6, 2018 February 5, 2019

2019 Southeast Acreage 2018 Actual 2019 Intended % Change Alabama 510 507-0.6% Florida118 111-6.1% Georgia1,430 1,379-3.6% North Carolina430 4300.1% South Carolina300 284 -5.4% Virginia 98 101 3.5% Southeast2,886 2,812-2.6%Total may not add due to rounding.

2019 Mid-South Acreage 2018 Actual 2019 Intended % Change Arkansas 485 55514.4% Louisiana195 23822.2% Mississippi620 73418.4% Missouri325 3476.9%Tennessee360 381 5.9% Mid-South 1,985 2,25613.6%Total may not add due to rounding.

2019 Southwest Acreage 2018 Actual 2018 Intended % Change Kansas 1651713.4%Oklahoma 7807881.0%Texas 7,7007,8742.3%Southwest 8,6458,8332.2% Total may not add due to rounding.

2019 West Acreage 2018 Actual 2019 Intended % Change Arizona 150 1511.0%California50 5714.4%New Mexico78 78-0.6%West2782862.9% Total may not add due to rounding.

2019 ELS Acreage 2018 Actual 2019 Intended % Change Arizona1411-19.9%California2102309.7%New Mexico77-1.4%Texas1715-10.0%ALL ELS248264 6.3% Total may not add due to rounding.

2019 U.S. Cotton Acreage 2018 2019 % Actual Intended Change Southeast 2,886 2,812-2.6%Mid-South1,9852,25613.6%Southwest8,6458,8332.2%West2782862.9% All Upland 13,794 14,186 2.8% ALL ELS2482646.3%All Cotton14,04214,4502.9%

U.S. Cotton Production 17/18 18/19 19/20 Change Planted (Mil Ac) 12.7 14.1 14.5+0.4% Un-harvested12.7%25.3%10.1%-15.2%Harvested (Mil Ac)11.110.513.0+2.5Yield905838840 +2 Production (Mil Ba) 20.9 18.4 22.7+4.3

U.S. Cottonseed Production Million tons

U.S. Balance Sheet 17/18 18/19 19/20 Change Production 20.92 18.39 22.72+4.33Mill Use3.233.20Exports15.8515.00Stocks4.304.30 Stocks/Use 22.5% 23.6% Million Bales

Net Domestic Fiber Consumption

Cotton Product Imports to US Market (% SME) 2008 2018

U.S. Cotton Mill Use

U.S. Balance Sheet 17/18 18/19 19/20 Change Production 20.92 18.39 22.72+4.33Mill Use3.233.203.25+0.05Exports15.8515.00Stocks4.304.30 Stocks/Use 22.5% 23.6% Million Bales

U.S. Export Customers Thousand Bales As of Dec 27 2019 17/18 Shipments 17/18 Share 18/19 Commitments18/19ShareVietnam3,08619%2,60623%China2,52616%1,72015%Mexico 912 6% 1,071 9% Indonesia1,5039%1,0449%Pakistan1,3919%9098%Bangladesh 831 5% 875 8% Turkey 1,841 12% 535 5% Thailand 631 4% 442 4% South Korea 591 4% 414 4% India 748 5% 347 3% All Others 1,790 11% 1,408 12% Total 15,850 100% 11,371 100%

China Balance Sheet 17/18 18/19 19/20 Change Production 27.5 27.5 26.2-1.3Mill Use41.040.541.4+0.9Imports5.77.511.1+3.6Stocks38.032.428.2 -4.2 Stocks/Use 92% 80% 68%-12%Million Bales

U.S. Balance Sheet 17/18 18/19 19/20 Change Production 20.92 18.39 22.72+4.33Mill Use3.233.203.25+0.05Exports15.8515.0017.45+2.45Stocks4.304.306.10+1.8 Stocks/Use 22.5% 23.6% 29.6% +6.0%Million Bales

World Production 17/18 18/19 19/20 Change India 29.0 27.0 28.0+1.0China27.527.526.6-0.9U.S.20.918.422.7+4.3Pakistan8.2 7.5 7.9 +0.4 Brazil 9.211.412.0+0.6Australia4.72.64.2+1.6Million Bales

World Consumption 17/18 18/19 19/20 Change China 41.0 40.5 41.4+0.9India24.124.825.5+0.7Pakistan10.810.610.7+0.1Bangladesh7.58.0 8.3 +0.3 Vietnam 6.6 7.57.7+0.2Turkey7.46.86.9+0.1Million Bales

World Balance Sheet 17/18 18/19 19/20 Change Production 123.7 118.5 125.5+7.0Mill Use122.6123.6126.5+2.89Trade40.942.345.9+3.6Stocks81.075.574.2-1.3 China 38.0 32.4 28.2 -4.2 All Others43.043.146.0+2.9Million Bales

Cotton Prices

Final ThoughtsU.S.-China trade dispute remains a key uncertainty 2019 projections based on assumption of trade resolutionIf a resolution is not reachedU.S. exports would be lowerChina mill use would likely be lowerU.S. ending stocks would be higher

Merchants Ginners Cottonseed Producers Cooperatives Warehouses Manufacturers