/
Stocking  Density  and Diet Quality Stocking  Density  and Diet Quality

Stocking Density and Diet Quality - PowerPoint Presentation

yvonne
yvonne . @yvonne
Follow
65 views
Uploaded On 2023-11-08

Stocking Density and Diet Quality - PPT Presentation

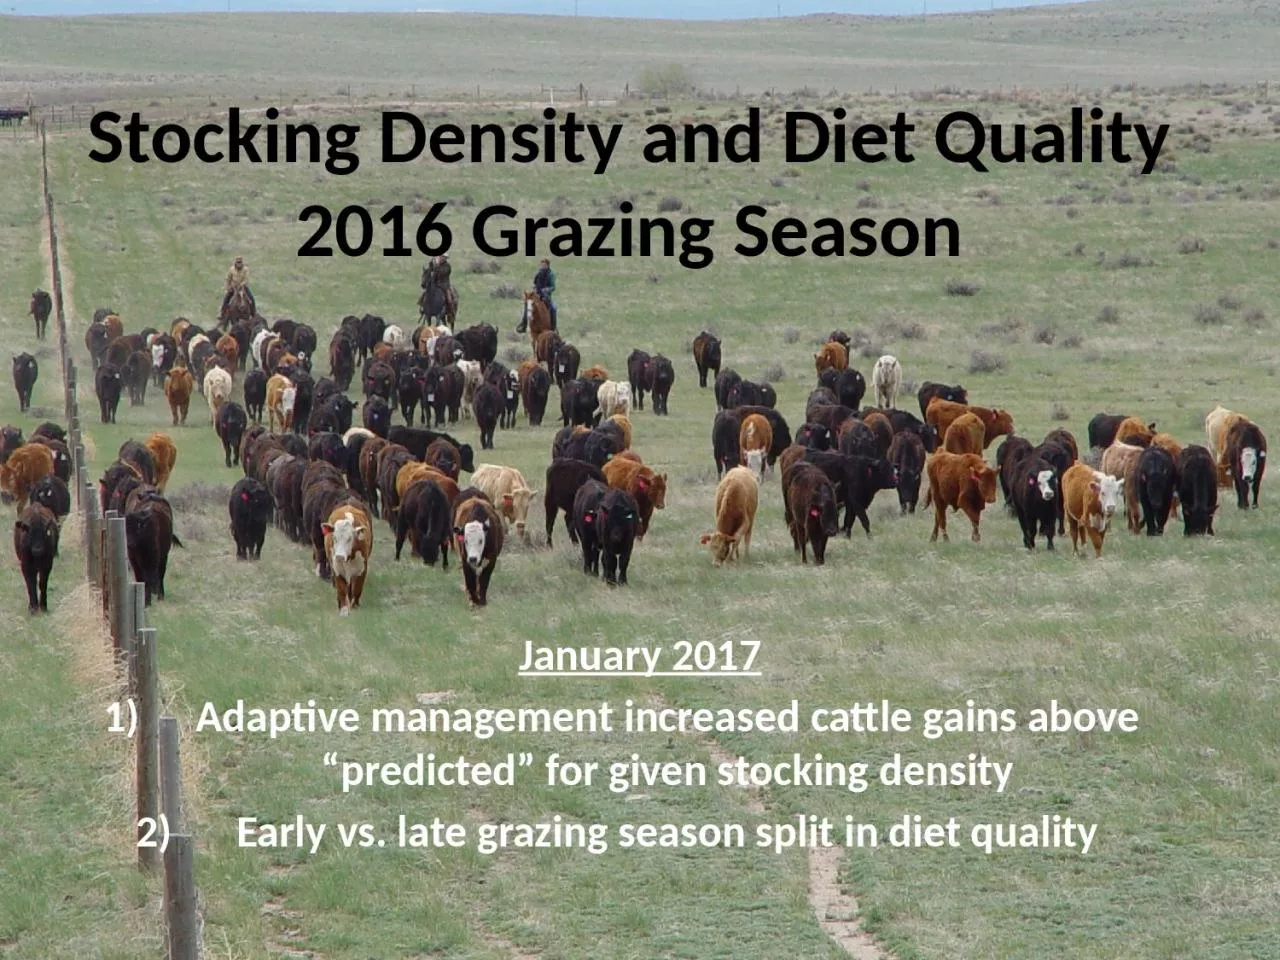
2016 Grazing Season January 2017 Adaptive management increased cattle gains above predicted for given stocking density Early vs late grazing season split in diet quality Steer Density Effects on Weight Gains 2016 ID: 1030400

gains dom 2016 loamy dom gains loamy 2016 herds sandy season rotational weight grazing density adaptive fecal effects steer

Share:

Link:

Embed:

Download Presentation from below link

Download Presentation The PPT/PDF document "Stocking Density and Diet Quality" is the property of its rightful owner. Permission is granted to download and print the materials on this web site for personal, non-commercial use only, and to display it on your personal computer provided you do not modify the materials and that you retain all copyright notices contained in the materials. By downloading content from our website, you accept the terms of this agreement.


Presentation Transcript

1. Stocking Density and Diet Quality2016 Grazing SeasonJanuary 2017Adaptive management increased cattle gains above “predicted” for given stocking densityEarly vs. late grazing season split in diet quality

2. Steer Density Effects on Weight Gains 2016Many small herds, no rotationLarger herds, rotational, not adaptiveLargest herd, rotational and adaptive

3. Steer Density Effects on Weight Gains 2016Small herds, no rotationLarger herds, rotational, not adaptiveLargest herd, rotational and adaptive??

4. Steer Density Effects on Weight Gains 2016Many small herds, no rotationLarger herds, rotational, not adaptive

5. Weight gains (approx. 0.25 pounds/head/day) attributed to “adaptive management”Steer Density Effects on Weight Gains 2016Many small herds, no rotationLarger herds, rotational, not adaptiveLargest herd, rotational and adaptive

6. Tell the story:Remind the stakeholders of what we found with DOM from 2015Remind them that we only presented CP in Sept 2016 meeting, and we forgotto present the DOM data.We would like to present the DOM and CP data to them now, and discuss whatwe can learn from themShow loamy vs. sandy DOM and CP first.

7. Loamy vs. Sandy fecal crude protein (%) 2016Stairsteps of dietary crude protein over grazing season.Most of the season:Loamy > SandyVery high animal gainsGood animal gainsMarginal animal gains

8. Loamy vs. Sandy fecal DOM (%) 2016Similar stairsteps of dietary DOM over grazing season.BUTMost of the season:Sandy > Loamy

9. Diet Quality Insights from 2016:DOM (Digestible Organic Matter): Sandy > LoamyCP (Crude Protein): Loamy > SandyWhich one predicts growing-season cattle weight gains?Actual 2016 cattle gains: Sandy (2.1) > Loamy (1.9)Implication: DOM is important indicator for growing-season cattle weight gains

10. AGM vs. TGM fecal DOM (%) 2016High quality diet when grazing Snowfence and HQ in Sept

11. AGM vs. TGM fecal DOM (%) 2016

12. Crossroads Pasture, 2016

13. Hilltank Pasture, 2016

14. AGM vs. TGM fecal DOM (%) 2016Forage biomass estimates of 520 – 580 lbs/ac based on VOR

15. Other slidesDOMDOM:CP ratio

16. AGM vs. TGM DOM:CP ratio 2016

17. Loamy vs. Sandy DOM:CP ratio 2016