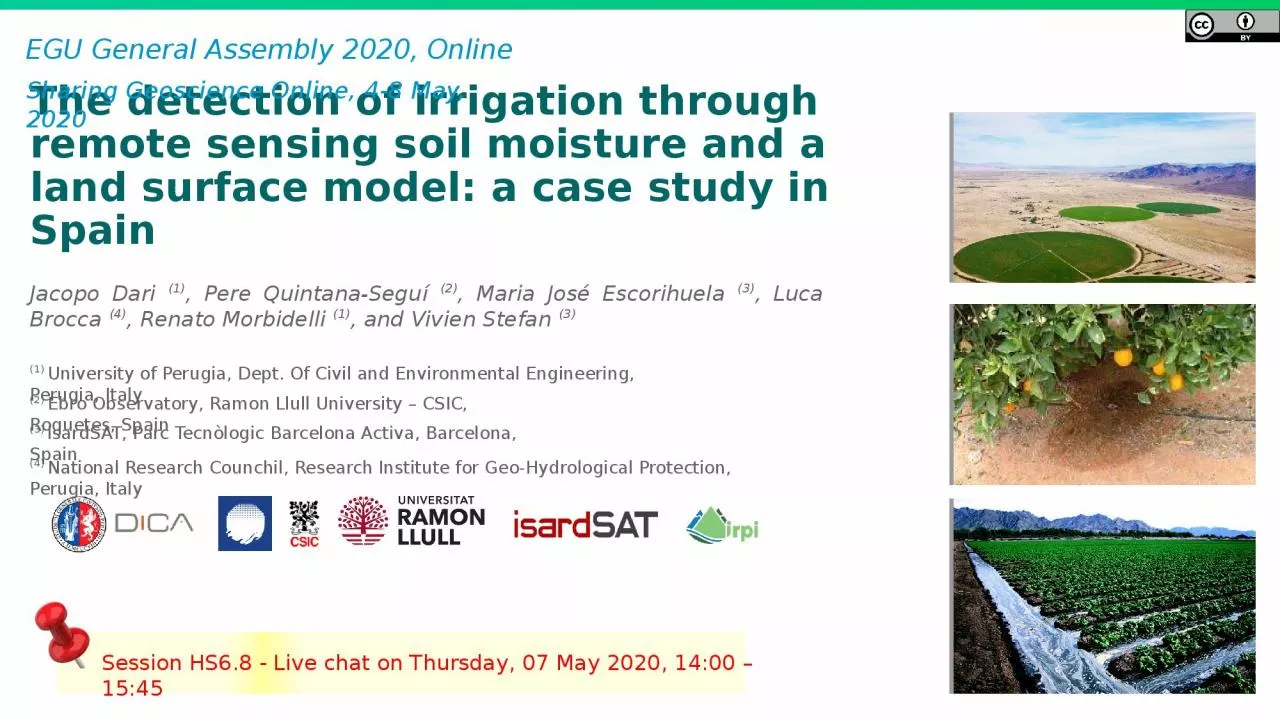
Jacopo Dari 1 Pere Quintana Seguí 2 Maria José Escorihuela 3 Luca Brocca 4 Renato Morbidelli 1 and Vivien Stefan 3 1 University of Perugia ID: 934824
Download Presentation The PPT/PDF document "The detection of irrigation through rem..." is the property of its rightful owner. Permission is granted to download and print the materials on this web site for personal, non-commercial use only, and to display it on your personal computer provided you do not modify the materials and that you retain all copyright notices contained in the materials. By downloading content from our website, you accept the terms of this agreement.
Slide1
The
detection of irrigation through remote sensing soil moisture and a land surface model: a case study in Spain
Jacopo
Dari
(1)
, Pere Quintana-
Seguí
(2), Maria José Escorihuela (3), Luca Brocca (4), Renato Morbidelli (1), and Vivien Stefan (3)
(1)
University
of Perugia,
Dept. Of Civil and Environmental Engineering, Perugia, Italy
(2) Ebro Observatory, Ramon Llull University – CSIC, Roquetes, Spain
(3) isardSAT, Parc Tecnòlogic Barcelona Activa, Barcelona, Spain
(4) National Research Counchil, Research Institute for Geo-Hydrological Protection, Perugia, Italy
EGU General Assembly 2020, Online
Sharing Geoscience Online, 4-8 May, 2020
Session HS6.8 - Live chat on Thursday, 07 May 2020, 14:00 – 15:45
Slide2Key question:
Do we know where irrigation
practices
actually
occur
?
Abstract:
Irrigation practices introduce imbalances in the natural hydrological cycle at different spatial scales and put pressure on water resources, especially under climate changing and population increasing scenarios. Despite the implications of irrigation on food production and on the rational management of the available freshwater, detailed information about the areas where irrigation actually occurs is still lacking. For this reason, the comprehensive knowledge of the dynamics of the hydrological cycle over agricultural areas is often tricky
.
1/10The first aim of this study is to evaluate the capability of five remote sensing soil moisture data sets to detect the irrigation signal over an intensely irrigated area located within the Ebro river basin, in the North of Spain, during the biennium 2016-2017. As a second objective, a methodology to map the irrigated areas through the K-means clustering algorithm is proposed. The remotely sensed soil moisture products used in this study are: SMOS (Soil Moisture and Ocean Salinity) at 1 km, SMAP (Soil Moisture Active Passive) at 1 km and 9 km, Sentinel-1 at 1 km and ASCAT (Advanced SCATterometer) at 12.5 km. The 1 km versions of SMOS and SMAP are DISPATCH (
DISaggregation based on Physical And Theoretical scale CHange
) downscaled versions of the corresponding coarser resolution products. An additional data set of soil moisture simulated by the SURFEX-ISBA (Surface Externalisée - Interaction Sol Biosphère Atmosphère)
land surface model is used as a support for the performed analyses.The
capability of soil moisture products to detect irrigation has been investigated by exploiting indices representing the spatial and temporal dynamics of soil moisture. The L-band passive microwave downscaled products, especially SMAP at 1 km, result the best performing ones in detecting the irrigation signal over the pilot area; on the basis of these data sets, the K-means algorithm has been employed to classify three kind of surfaces within the study area: the dryland, the forest or natural areas, and the actually irrigated areas. The resulting maps have been validated by exploiting maps of crops in Catalonia as ground truth data set. The percentage of irrigated areas well classified by the proposed method reaches the value of 78%; this result is obtained for the period May - September 2017. In addition, the method performs well in distinguishing the irrigated areas from rainfed agricultural areas, which are dry during summer, thus representing a useful tool to obtain explicit spatial information about where irrigation practices actually
occurr over agricultural areas equipped for this purpose.Please see the notes for further details and referencesRecent updates:
Good preliminary results in quantitatively estimating irrigation volumes from remotely sensed surface soil moisture.
Slide3Study area:
We selected an intensely irrigated area within
the Ebro
river
basin
(North-East of Spain
).
It is
a data rich area.From Siebert et al., 2013C081C101C117C116
Irrigated
areas
Sub-
basin
simulated
with SURFEX LSMStudy area (focus)2/10
Slide4Detecting and mapping irrigated areas:
Temporal stability derived indices
have
been
exploited
. The
mathematics of
this well-established
theory is used to derive indices representing the spatial and temporal dynamics of soil moisture.
Evaluation of the capability to
detect
irrigation of five
remote sensing soil moisture
products:SMOS (1 km)SMAP (1 km, 9 km)Sentinel-1 (1 km)ASCAT (12.5 km)SMOS and SMAP
at 1 km are DISPATCH downscaled verions of the coarser resolution products. An additional
data set of soil moisture at 1 km simulated by the SURFEX-ISBA LSM is used;
Irrigation mapping through the K-means clustering alghoritm.
Catalan and Aragonese area
Urgell areaTemporal stability derived indices
t
Spatial mean
at
day
t
δ
x, t
= (
θ
x,t
-
t)
)/
t
Relative
differences
:
x
Temporal
mean
A
x, t
= (
θ
x, t
-
x
)/
x
Temporal
anomalies
:
i
j
t
x, t
Ex. of data set
Vauchad
et al., 1985
3/10
Slide5Spatial analysis:
Over the irrigable land
, the spatial
relative differences
are
expected to assume
higher
values (greater
than zero) than over the surronding dryland. Good performaces of the L-band passive microwave downscaled products (SMOS and SMAP at 1 km).
The model can be considered
as a
reference for a situation
not taking into account of irrigation
.4/10
Slide6Temporal analysis:
Over the irrigable land
, the temporal
anomalies
are
expected to assume
higher
values (greater
than or equal to zero) than over the surronding dryland. Good performaces of the L-band passive microwave downscaled products (SMOS and SMAP at
1 km).
The model can be considered
as a
reference for a situation not taking into
account of irrigation.5/10
Slide7Correlation analysis:
The correlation
between
modeled
and remotely
sensed
soil
moisture
has been calculated.The satellite soil moisture products containining the irrigation signal are expected
to show low (
scarce
correlation) or negative (inverse correlation
) correlation coefficients over irrigated
areas.6/10
Slide8K-means clustering classification:
Over the study area, three main kinds of
surfaces
can be detected
: the dryland
(D), the
forest
or natural
areas (F), and the
actually irrigated areas (I).The clustering has been carried out considering 16 different combinations of the input
parameters; 8 of these
exploit remote sensing data
only and 8 merge remotely
sensed and modeled soil
moisture. Validation:Maps of crops in Catalonia from SIGPAC have
been exploited as ground truth data set in two different
ways.
First procedureSecond procedureExploits the irrigation
information.
Exploits the information about the kind of crops
.7/10
Slide9Validation results – confusion matrices:
First validation procedure:
Second
validation
procedure:
8/10
Slide10Validation results – best performing classifications
:Good performances in distinguishing
between
irrigated
areas and
rainfed
agricultural areas.
For both the validation procedures, the best performing classifications are the same: STASMAP16 (51%, 65%) and STASMAP17 (65%, 78%) best represent the irrigated areas, DACSMAP16 and DACSMAP17 best represent
all the
three classes
concurrently.
It is noteworthy
that the model does not add information for the irrigation mapping. Conversely,
it helps in enhancing the classification of the other classes.
In conclusion:The L-band passive microwave downscaled products, especially SMAP at 1 km, are
able to detect irrigation over the study area;temporal stability derived
indices are
useful to evaluate the performances of remotely sensed
data sets in detecting the irrigation signal;
the
proposed
method
reaches
good
accuracy
in
mapping
irrigated
areas
by
exploiting
remote
sensing
soil
moisture
only
.
Furthermore
, the
actually
irrigated
areas
and the
rainfed
agricultural
areas
are
well
distinguished
;
recursive
confusion
between
irrigated
areas
and
natural
areas
can be
observed
.
9/10
Slide11Future perspectives:
Estimation of irrigation volumes for each irrigation district.
Preliminary results show good agreement between estimated and observed irrigation amounts.
The irrigation volumes are estimated through an adapted version of
t
he SM2RAIN algorithm (
Brocca et al., 2018), in which the evapotranspiration term has been improved according to the FAO irrigation and drainage paper n. 56 (Allen et al., 1998). The results are obtained by exploiting soil moisture from the DISPATCH downscaled SMAP at 1 km data set.
Except for
Pinyana district, the total irrigation volumes for the year 2016 and for the period January-September 2017 are well reproduced by our method.
How much water is used for irrigation?For further information do not hesitate to contact:jacopo.dari@unifi.it10/10
Jacopo Dari
PhD Student