/
True stress and True strain True stress and True strain

True stress and True strain - PowerPoint Presentation

PeacefulPassion
PeacefulPassion . @PeacefulPassion
Follow
342 views
Uploaded On 2022-08-03

True stress and True strain - PPT Presentation

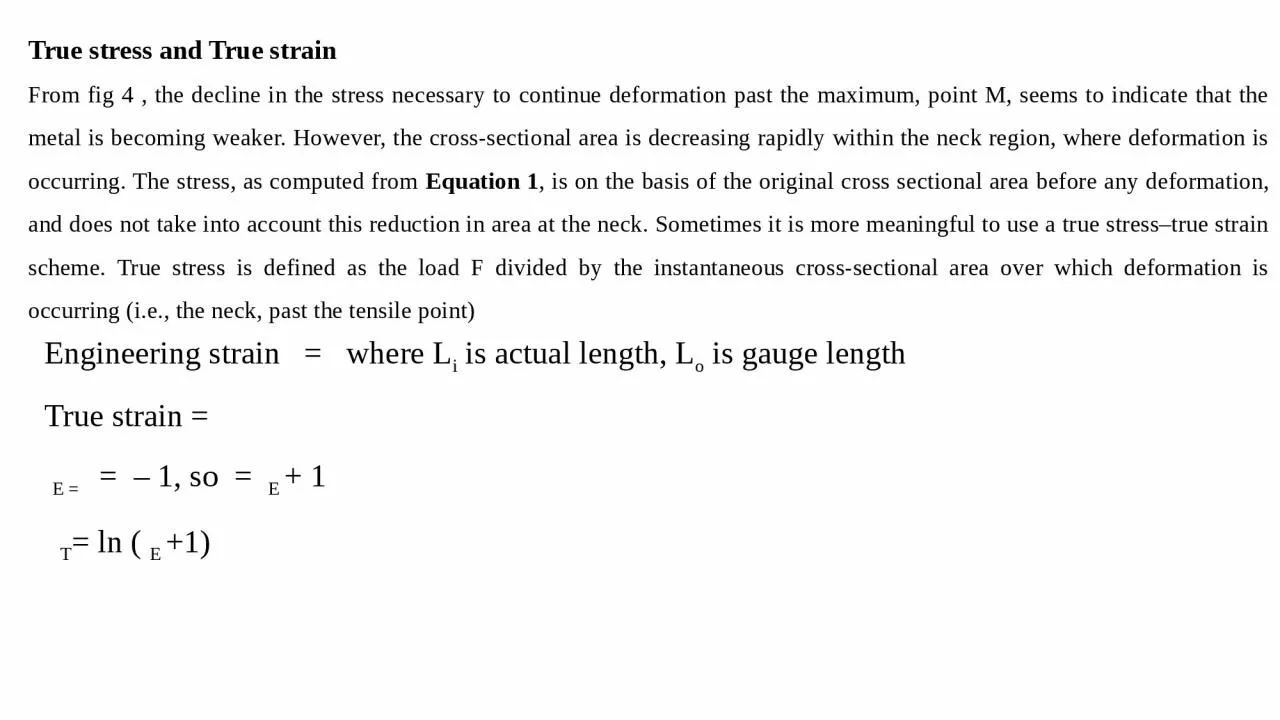
From fig 4 the decline in the stress necessary to continue deformation past the maximum point M seems to indicate that the metal is becoming weaker However the crosssectional area is decreasing rapidly within the neck region where deformation is occurring The stress as computed from ID: 933294

strain stress true mpa stress strain mpa true fracture deformation area strength length crack specimen load curve tensile maximum

Share:

Link:

Embed:

Download Presentation from below link

Download Presentation The PPT/PDF document "True stress and True strain" is the property of its rightful owner. Permission is granted to download and print the materials on this web site for personal, non-commercial use only, and to display it on your personal computer provided you do not modify the materials and that you retain all copyright notices contained in the materials. By downloading content from our website, you accept the terms of this agreement.


Presentation Transcript

Slide1

True stress and True strainFrom fig 4 , the decline in the stress necessary to continue deformation past the maximum, point M, seems to indicate that the metal is becoming weaker. However, the cross-sectional area is decreasing rapidly within the neck region, where deformation is occurring. The stress, as computed from Equation 1, is on the basis of the original cross sectional area before any deformation, and does not take into account this reduction in area at the neck. Sometimes it is more meaningful to use a true stress–true strain scheme. True stress is defined as the load F divided by the instantaneous cross-sectional area over which deformation is occurring (i.e., the neck, past the tensile point)

Engineering strain = where Li is actual length, Lo is gauge lengthTrue strain = E = = – 1, so = E + 1 T= ln (E +1) 


Slide2

Engineering stress E = F / Ao where

Ao is original area True stress (T) = F/ Ai , where Ai is the area where the fracture occurring at the necking region Since the volume is constant Ao L0 = Ai Li >>>>> Ai = [ ] / AoT = F/ Ai = [

]

T = E (E +1)For some metals and alloys, the region of the true stress/ strain curve up to M’ is approximated by:T = K T n Where K and n are constants depend on whether the material has been cold worked, heat treated, etc


Slide3

Figure (10) True stress-strain curve

Slide4

Ductile and Brittle materials fractureFracture: separation of a body into pieces due to stress, at temperatures below the melting point. Steps in fracture: 1- crack formation 2- crack propagation

In ductile fracture, the crack grows at a slow pace and is accompanied with a great deal of plastic deformation due to the motion of dislocation. In this, the crack does not expand except when high levels of stress are present.Under the view of a microscope, the surfaces of materials with ductile fracture appear irregular and rough, and exhibit some dimplingFigure (11) Steps of fracture for ductile materials Figure (12) Dislocations motion in ductile materials

Slide5

Very little or no plastic deformation, Crack propagation is very fast , Crack propagates nearly perpendicular to the direction of the applied stress, Crack often propagates by cleavage - breaking of atomic bonds along specific crystallographic planes (cleavage planes). Brittle Fracture

Figure (13) Crack propagation in Brittle materials Figure (12) difference in cracks for ductile and brittle materials

Slide6

Examples: For a bronze alloy, the stress at which plastic deformation begins is 280 MPa, and the modulus of elasticity is 115 GPa.

 What is the maximum load that may be applied to a specimen with a cross-sectional area of 325 mm2 without plastic deformation?If the original specimen length is 120 mm, what is the maximum length to which it may be stretched without causing plastic deformation? Solution:This portion of the problem calls for a determination of the maximum load that can be applied without plastic deformation (Fy). Taking the yield strength to be 280 MPa Fy = σy Ao = (280 N/mm2 )(325 mm2 ) = 91000 N   Lo= σ/E = 280x106 / 115x109 = 0.00243 Ly-

120mm

=

0.00243 x 120mmLy = 120.292 mm  

Slide7

Example #2:From the tensile stress–strain behavior for the brass specimen shown in Figure below determine the following:(a)

The modulus of elasticity(b) The yield strength at a strain offset of 0.002(c) The maximum load that can be sustained by a cylindrical specimen havingan original diameter of 12.8 mm (d) The change in length of a specimen originally 250 mm long thatis subjected to a tensile stress of 345 MPa

Slide8

E = slope = =

= Its easier if we take 1 and 1 as zero. For 2 = 150 MPa and 2 = 0.0016 , so E= = 93.8 GPa  

Slide9

(b) The 0.002 strain offset line is constructed as shown in the inset; its intersection with the stress–strain curve is at approximately 250 MPa which is the yield strength of the brass. ( c ) From

the fig, the maximum tensile strength is 450 MPaFmax = max(ult) Ao = max(ult) x ( r2)Fmax = ( 450 N/mm2 ) x ( (6.4 mm)2) F max = 57900 N (d) first necessary to determine the strain that is produced by a stress of 345 MPa. This is accomplished by locating the stress point on the stress–strain curve, point A, and reading the corresponding strain from the strain axis, which is approximately 0.06. Inasmuch as Lo= 250 mm, we have  L

o

= 0.06 x 250 mm = 15mm.


Slide10

Example 3:A cylindrical specimen of steel having an original diameter of 12.8 mm is tensile tested to fracture and found to have an engineering fracture strength of 460 MPa. If its cross-sectional diameter at fracture is 10.7 mm, determine:(a) The ductility in terms of percent reduction in area

(b) The true stress at fracture(a) % RA= (Ao-Af / A0 ) x 100 %RA= x 100 = 30%(b) True stress is defined the area is taken as the fracture area Af However, the load at fracture must first be computed from the fracture strength asF = f Ai = 460

MPa

x [

 (12.8/2 mm)2] = 59200 Nf represents engineering stress E which is determined using the initial area T = F / AfT = 59200/  (10.7/2)2 T = 660 MPa


Slide11

Example 4: A cylindrical specimen of aluminum having a diameter of 12.8 mm and a gauge length of 50.800 mm is pulled in tension. Use the load–elongation characteristics shown in the following table to complete parts (a) through (e). Load Length

N mm0 50.8007,330 50.85115,100 50.90223,100 50.95230,400 51.00334,400 51.05438,400 51.30841,300 51.81644,800 52.83246,200 53.84847,300 54.86447,500 55.88046,100 56.89644,800 57.65842,600 58.42036,400 59.1(a) Plot the data as engineering stress versus engineering strain.(b) Compute the modulus of elasticity.(c) Determine the yield strength at a strain offset of 0.002.(d) Determine the tensile strength of this alloy.(e) What is the approximate ductility, in percent elongation?

Slide12

The data are plotted below on two plots: the first corresponds to the entire stress–strain curve, while for the second, the curve extends to just beyond the elastic region of deformation. = F/AWhen the load is 7330 N , so = F/

 r2 = 7330 /  (12.8/2)2 = 57 MPa At F= 15100 N ,  = 15100 /  (12.8/2)2 = 117.4 MPaThen, we can do the same calculations for the resting loads to find their stresses = , when F=0, so no change in length will be occurred =0 and =0 F= 7330, = = 0.001 F= 15100, = = 0.002

Then, we can do the same calculations for the resting loads to find their strain


Slide13

Slide14

(b) The elastic modulus is the slope in the linear elastic regionE =

= = 62.5 x10³ MPa = 62.5 GPa(c) For the yield strength, the 0.002 strain offset line is drawn dashed. It intersects the stress–strain curve at approximately 285 MPa.(d) The tensile strength is approximately 370 MPa, corresponding to the maximum stress on the complete stress-strain plot. (e) % EL= x 100 = x100 = 16.33 % 

Slide15

Example 5 :   For some metal alloy, a true stress of 345 MPa produces a plastic true strain of 0.02. How much will a specimen of this material elongate when a true stress of 415

MPa is applied if the original length is 500 mm? Assume a value of 0.22 for the strain-hardening exponent, n. σT = K (εT) n Next we must solve for the true strain produce when a true stress of 415 MPa is applied