/
Development of a  Pan-Cancer Development of a  Pan-Cancer

Development of a Pan-Cancer - PowerPoint Presentation

ThoughtfulTurtle
ThoughtfulTurtle . @ThoughtfulTurtle
Follow
342 views
Uploaded On 2022-08-02

Development of a Pan-Cancer - PPT Presentation

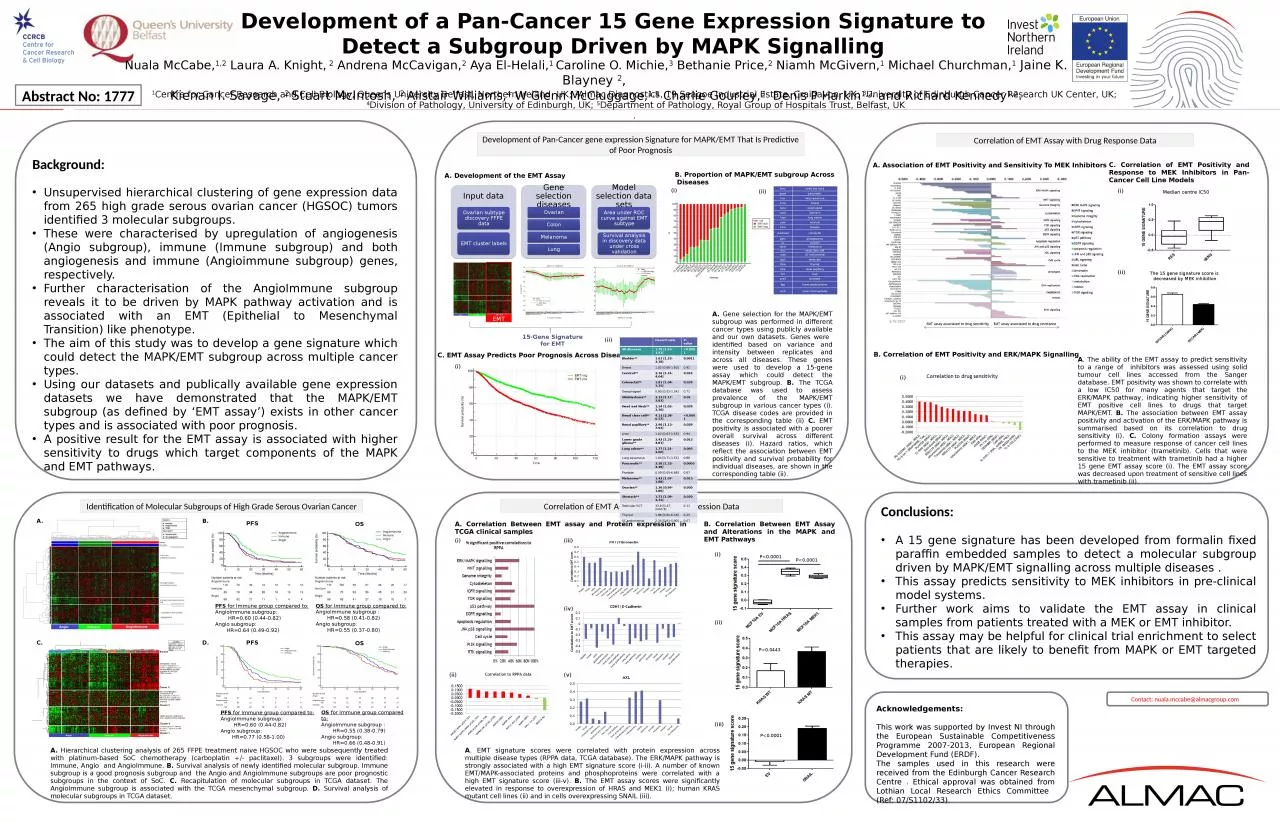
15 Gene E xpression S ignature to Detect a Subgroup D riven by MAPK Signalling Abstract No 1777 1 Centre for Cancer Research and Cell Biology Queens University Belfast Northern Ireland ID: 932400

subgroup emt assay mapk emt subgroup mapk assay cancer gene angioimmune immune signature cell tcga expression angio subgroups correlation

Share:

Link:

Embed:

Download Presentation from below link

Download Presentation The PPT/PDF document "Development of a Pan-Cancer" is the property of its rightful owner. Permission is granted to download and print the materials on this web site for personal, non-commercial use only, and to display it on your personal computer provided you do not modify the materials and that you retain all copyright notices contained in the materials. By downloading content from our website, you accept the terms of this agreement.


Presentation Transcript

Slide1

Development of a

Pan-Cancer

15

Gene Expression Signature to Detect a Subgroup Driven by MAPK Signalling

Abstract No: 1777

1

Centre for Cancer Research and Cell Biology, Queens University Belfast, Northern Ireland,

UK;

2Almac Diagnostics, 19 Seagoe Industrial Estate, Craigavon, UK; 3University of Edinburgh Cancer Research UK Center, UK; 4Division of Pathology, University of Edinburgh, UK; 5Department of Pathology, Royal Group of Hospitals Trust, Belfast, UK.

Background:

Development

of Pan-Cancer gene expression Signature for MAPK/EMT That Is Predictive of Poor Prognosis

Correlation of EMT Assay with Protein Expression Data

Correlation of EMT Assay with Drug Response Data

A

. The ability of the EMT assay to predict sensitivity to a range of inhibitors was assessed using solid tumour cell lines accessed from the Sanger database. EMT positivity was shown to correlate with a low IC50 for many agents that target the ERK/MAPK pathway, indicating higher sensitivity of EMT positive cell lines to drugs that target MAPK/EMT.

B

.

The association between EMT assay positivity and activation of the ERK/MAPK pathway is summarised based on its correlation to drug sensitivity (i). C. Colony formation assays were performed to measure response of cancer cell lines to the MEK inhibitor (trametinib). Cells that were sensitive to treatment with trametinib had a higher 15 gene EMT assay score (i). The EMT assay score was decreased upon treatment of sensitive cell lines with trametinib (ii).

Conclusions:A 15 gene signature has been developed from formalin fixed paraffin embedded samples to detect a molecular subgroup driven by MAPK/EMT signalling across multiple diseases .This assay predicts sensitivity to MEK inhibitors in pre-clinical model systems.Further work aims to validate the EMT assay in clinical samples from patients treated with a MEK or EMT inhibitor.This assay may be helpful for clinical trial enrichment to select patients that are likely to benefit from MAPK or EMT targeted therapies.

Acknowledgements:

This work was supported by Invest NI through the European Sustainable Competitiveness Programme 2007-2013, European Regional Development Fund (ERDF).The samples used in this research were received from the Edinburgh Cancer Research Centre . Ethical approval was obtained from Lothian Local Research Ethics Committee (Ref: 07/S1102/33).

Contact: nuala.mccabe@almacgroup.com

PFS

O

S

Identification of Molecular Subgroups of High Grade Serous Ovarian Cancer

A.

Hierarchical clustering analysis

of 265 FFPE treatment naive HGSOC who

were subsequently treated with platinum-based SoC chemotherapy (carboplatin +/- paclitaxel). 3 subgroups were identified: Immune, Angio and AngioImmune. B. Survival analysis of newly identified molecular subgroup. Immune subgroup is a good prognosis subgroup and the Angio and AngioImmune subgroups are poor prognostic subgroups in the context of SoC. C. Recapitulation of molecular subgroups in TCGA dataset. The AngioImmune subgroup is associated with the TCGA mesenchymal subgroup. D. Survival analysis of molecular subgroups in TCGA dataset.

B. Proportion of MAPK/EMT subgroup Across Diseases

B.

D.

Unsupervised hierarchical clustering of gene expression data from 265 high grade serous ovarian cancer (HGSOC)

tumors identified 3 molecular subgroups. These were characterised by upregulation of angiogenesis (Angio subgroup), immune (Immune subgroup) and both angiogenesis and immune (Angioimmune subgroup) genes, respectively. Further characterisation of the AngioImmune subgroup reveals it to be driven by MAPK pathway activation and is associated with an EMT (Epithelial to Mesenchymal Transition) like phenotype.The aim of this study was to develop a gene signature which could detect the MAPK/EMT subgroup across multiple cancer types.Using our datasets and publically available gene expression datasets we have demonstrated that the MAPK/EMT subgroup (as defined by ‘EMT assay’) exists in other cancer types and is associated with poor prognosis.A positive result for the EMT assay is associated with higher sensitivity to drugs which target components of the MAPK and EMT pathways.

A.

C

.

OS

for Immune group compared to:AngioImmune subgroup : HR=0.55 (0.38-0.79) Angio subgroup: HR=0.66 (0.48-0.91)

PFS for Immune group compared to:AngioImmune subgroup: HR=0.60 (0.44-0.82) Angio subgroup: HR=0.64 (0.49-0.92)

OS for Immune group compared to:AngioImmune subgroup : HR=0.58 (0.41-0.82) Angio subgroup: HR=0.55 (0.37-0.80)

PFS for Immune group compared to:AngioImmune subgroup: HR=0.60 (0.44-0.82) Angio subgroup: HR=0.77 (0.58-1.00)

PFS

O

S

hnsc

head and neck

paad

pancreaticlusclung sqaumousbrcabreastescaoesphagealstadstomachluadlung adenocesccervicalblcabladdercoadreadcolorectalgbmglioblastomaovovarianskcmmelanomakircrenal clear cellucecUC endometrialtgcttesticularthcathyroidkirprenal papillarylihcliverpradprostatelgglower grade gliomakichrenal chromophobe

C. EMT Assay Predicts Poor Prognosis Across Diseases

Hazard ratioP-valueAll diseases1.78 [1.65-1.92]<0.0001Bladder**1.63 [1.22-2.18]0.0011Breast1.02 [0.66-1.60]0.92Cervical**2.16 [1.16-4.04]0.016Colorectal**1.83 [1.04-3.25]0.039Oesophageal0.90 [0.53-1.54]0.71Glioblastoma**2.12 [1.17-3.83]0.01Head and Neck**1.54 [1.02-2.30]0.039Renal clear cell**4.12 [2.58-6.57]<0.0001Renal papillary**2.98 [1.12-7.93]0.029Liver1.02 [0.63-1.65]0.94Lower grade glioma**2.42 [1.22-4.81]0.012Lung adeno**1.77 [1.21-2.60]0.003Lung squamous1.04 [0.71-1.51]0.86Pancreatic**2.58 [1.52-4.38]0.0005Prostate0.59 [0.05-6.68]0.67Melanoma**1.42 [1.07-1.88]0.015Ovarian**1.36 [0.99-1.86]0.050Stomach**1.73 [1.09-2.75]0.020Testicular GCT33.8 [0.47-2443.5]0.11Thyroid1.96 [0.62-6.18]0.25UC endometrial2.34 [0.93-5.90]0.07

EMT

A.

Gene selection for the MAPK/EMT subgroup was performed in different cancer types

using publicly available and our own datasets. Genes were identified based on variance and intensity between replicates and across all diseases. These genes were used to develop a 15-gene assay which could detect the MAPK/EMT subgroup.

B.

The TCGA database was used to assess prevalence of the MAPK/EMT subgroup in various cancer types

(i). TCGA disease codes are provided in the corresponding table (ii) C. EMT positivity is associated with a poorer overall survival across different diseases (i). Hazard ratios, which reflect the association between EMT positivity and survival probability for individual diseases, are shown in the corresponding table (ii).

A

. EMT signature scores were correlated with protein expression across multiple disease types (RPPA data, TCGA database).

The ERK/MAPK pathway is strongly associated with a high EMT signature score (i-ii). A number of known EMT/MAPK-associated proteins and phosphoproteins were correlated with a high EMT signature score (iii-v). B. The EMT assay scores were significantly elevated in response to overexpression of HRAS and MEK1 (i); human KRAS mutant cell lines (ii) and in cells overexpressing SNAIL (iii).

A. Development of the EMT Assay

A. Correlation Between EMT assay and Protein expression in TCGA clinical samples

A. Association of EMT Positivity and Sensitivity To MEK Inhibitors

B

. Correlation of EMT Positivity and ERK/MAPK Signalling

15-Gene Signature for EMT

(

i

)

(ii)

(ii)

(

i)

(i)

(iii)

(iv)

(v)

(i)

(i)

Nuala McCabe,1,2 Laura A. Knight, 2 Andrena McCavigan,2 Aya El-Helali,1 Caroline O. Michie,3 Bethanie Price,2 Niamh McGivern,1 Michael Churchman,1 Jaine K. Blayney 2, Kienan I. Savage, 2 Stuart McIntosh, 2 Alistair Williams,4 W Glenn McCluggage,1,5 Charlie Gourley,3 Denis P Harkin1,2, and Richard Kennedy1,2.

P<0.0001

P<0.0001

P=0.0443

(ii)

(

i

)

(ii)

(iii)

C

. Correlation of EMT Positivity and Response to MEK Inhibitors in Pan-Cancer Cell Line Models

Median centre IC50

The

15 gene signature score is

decreased

by MEK inhibition

(ii)

B

. Correlation Between EMT Assay and Alterations in the MAPK and EMT Pathways

P<0.0001