/
X-ray Diagnostics and Their Relationship to Magnetic Fields X-ray Diagnostics and Their Relationship to Magnetic Fields

X-ray Diagnostics and Their Relationship to Magnetic Fields - PowerPoint Presentation

aaron
aaron . @aaron
Follow
379 views
Uploaded On 2017-10-21

X-ray Diagnostics and Their Relationship to Magnetic Fields - PPT Presentation

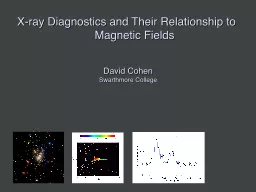
David Cohen Swarthmore College XMMNewton Chandra Launched 2000 superior sensitivity spatial resolution and spectral resolution sub arcsecond resolution XMMNewton Chandra Both have CCD detectors for imaging spectroscopy ID: 598213

plasma ori ray 1s2p ori plasma 1s2p ray kev hot magnetic emission xmm chandra forbidden measure pup intercombination star

Share:

Link:

Embed:

Download Presentation from below link

Download Presentation The PPT/PDF document "X-ray Diagnostics and Their Relationship..." is the property of its rightful owner. Permission is granted to download and print the materials on this web site for personal, non-commercial use only, and to display it on your personal computer provided you do not modify the materials and that you retain all copyright notices contained in the materials. By downloading content from our website, you accept the terms of this agreement.


Presentation Transcript

Slide1

X-ray Diagnostics and Their Relationship to Magnetic Fields

David CohenSwarthmore CollegeSlide2
Slide3

XMM-Newton

ChandraLaunched 2000: superior

sensitivity, spatial resolution, and

spectral resolution

sub-

arcsecond

resolutionSlide4

XMM-Newton

ChandraBoth have CCD detectors for imaging spectroscopy:

low spectral resolution: R ~ 20 to 50

And both have grating spectrometers:

R

~ few 100 to 1000Slide5
Slide6

q1

Ori C

Chandra

ACIS

Orion

Nebula

Cluster (COUP)

Color coded according to photon energy (red: <1keV;

green

1 to 2

keV

; blue > 2

keV

)Slide7
Slide8
Slide9

Stelzer et al. 2005q1

Ori C: X-ray lightcurveSlide10

s Ori E: XMM light curve

Sanz-Forcada et al. 2004Slide11

XMM EPIC spectrum of s Ori E

Sanz-Forcada et al. 2004Slide12

z

Pup

1

Ori C

Chandra grating

specra

:

1

Ori C

and a non-magnetic O star Slide13

Hot plasma emitting thermal x-rays1 keV ~ 12 × 106

K ~ 12 ÅROSAT 150 eV to 2 keVChandra, XMM

350 eV to 10 keV

Shock heating:

D

v

= 300 km gives T ~ 10

6

K (and T ~ v

2

)Slide14

Hot plasma emitting thermal x-rays1 keV ~ 12 × 106

K ~ 12 ÅROSAT 150 eV to 2 keVChandra, XMM

350 eV to 10 keV

Shock heating:

D

v

= 1000 km gives T ~ 10

7

K (and T ~ v

2

)Slide15
Slide16

z

Pup

1

Ori C

Si XIII

Si XIV

Mg XI

Mg XII

H-like

/

He-like

ratio is temperature sensitiveSlide17

z

Pup

1

Ori C

Si XIII

Si XIV

Mg XI

Mg XII

The magnetic O star –

1

Ori

C – is hotterSlide18

Differential Emission Measure

(temperature distribution)

Wojdowski & Schulz (2005)

q

1

Ori

C is much hotterSlide19

1000 km s-1

Emission lines are significantly narrower, too

q

1

Ori C

(O7 V)

z

Pup

(O4 If)Slide20

Wade et al. 2008Dipole magnetic field Slide21

Shore & Brown, 1990Slide22

Rotating tilted dipole

Simulation/visualization courtesy R. TownsendSlide23
Slide24

temperature

emission measure

MHD simulations of magnetically channeled wind

Channeled collision is close to

head-on:

D

v

> 1000

km s

-1

: T > 10

7

K

simulations by A.

ud

-Doula;

Gagné

et al. (2005)Slide25

Differential emission measure

(temperature distribution)

MHD simulation of 

1

Ori

C reproduces the observed differential emission measure

Wojdowski

& Schulz (2005)Slide26
Slide27

0.0

0.5

1.0

1.5

Simulation EM (10

56

cm

-3

)

0.0

0.1

0.2

0.3

0.4

θ

1

Ori C ACIS-I count rate (s

-1

)

0.0 0.2 0.4 0.6 0.8 1.0

Rotational phase (P=15.422 days)

Chandra

broadband count rate vs. rotational phase

Model from MHD simulationSlide28

0.0

0.5

1.0

1.5

Simulation EM (10

56

cm

-3

)

0.0

0.1

0.2

0.3

0.4

θ

1

Ori C ACIS-I count rate (s

-1

)

0.0 0.2 0.4 0.6 0.8 1.0

Rotational phase (P=15.422 days)

The star itself occults the hot plasma torus

The closer the hot plasma is to the star, the deeper the dip in the x-ray light curveSlide29

Emission measure

contour encloses T > 106 KSlide30

Helium-like species’ forbidden-to-intercombination

line ratios – f/i or z

/

(

x+y

)

– provide information about the

location

of the hot plasma

…not the

density

, as is usually the case. Slide31

g.s. 1s

2

1

S

1s2s

3

S

1s2p

3

P

1s2p

1

P

resonance (w)

intercombination (x+y)

forbidden (z)

10-20 eV

1-2 keV

Helium-like ions (e.g. O

+6

, Ne

+8

, Mg

+10

, Si

+12

, S

+14

) – schematic energy level diagramSlide32

1s2s

3

S

1s2p

3

P

1s2p

1

P

resonance (w)

intercombination (x+y)

forbidden (z)

g.s. 1s

2

1

S

Ultraviolet light from the star’s photosphere drives

photoexcitation

out of the

3

S level

UVSlide33

1s2s

3

S

1s2p

3

P

1s2p

1

P

resonance (w)

intercombination (x+y)

forbidden (z)

g.s. 1s

2

1

S

The

f/i

ratio is thus a diagnostic of the local UV mean intensity…

UVSlide34

1s2s

3

S

1s2p

3

P

1s2p

1

P

resonance (w)

intercombination (x+y)

forbidden (z)

g.s. 1s

2

1

S

…and thus the distance of the x-ray emitting plasma from the photosphere

UVSlide35

R

fir

=1.2 R*

R

fir

=4.0 R

*

R

fir

=2.1 R

*Slide36

He-like f/i

ratios and the x-ray light curve both indicate that the hot plasma is somewhat closer to the photosphere of q1

Ori C

than the MHD models predict. Slide37

Some slides showing f/i ratios in zeta Ori, tau Sco… main point: there is NO evidence for a “near star high ion problem” Slide38

z Pup S XV Chandra MEGSlide39
Slide40

More possible topics: Zeta Ori, HD191612 – magnetic but X-rays look “normal”

Tau Sco – narrow lines but f/i ratios imply plasma far from the photosphereSigma Ori E – X-ray DEM well reproduced by Rich’s RFHD modeling; flaring too (centrifugal breakout)Early B stars are mysterious – large x-ray luminosities, soft spectra, narrow lines but no evidence for magnetic fields (theta Car, beta Cru)Slide41

Conclusions

Some conclusions…