PPT-Supplementary Figure 1 8 slides for 4 panels (A-D)
Author : adia | Published Date : 2023-12-30
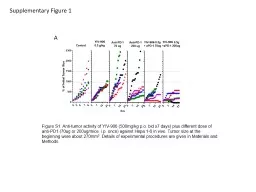
Kidney Gene Expression Fold Change Log2 Base ProInflammatory Innate Immune System Regulatory 6 Hours 24 Hours 72 Hours Cell Cycle Other Transcription Factors Apoptosis
Presentation Embed Code
Download Presentation
Download Presentation The PPT/PDF document "Supplementary Figure 1 8 slides for 4 pa..." is the property of its rightful owner. Permission is granted to download and print the materials on this website for personal, non-commercial use only, and to display it on your personal computer provided you do not modify the materials and that you retain all copyright notices contained in the materials. By downloading content from our website, you accept the terms of this agreement.
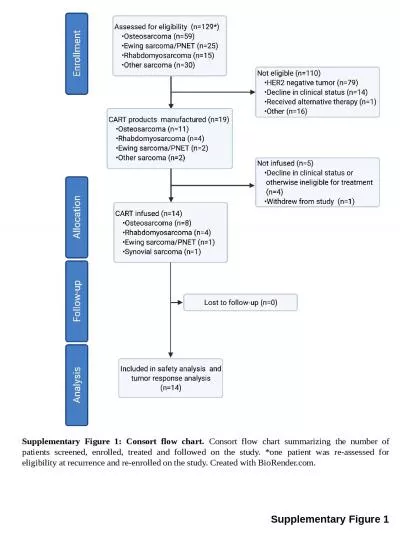
Supplementary Figure 1 8 slides for 4 panels (A-D): Transcript
Download Rules Of Document
"Supplementary Figure 1 8 slides for 4 panels (A-D)"The content belongs to its owner. You may download and print it for personal use, without modification, and keep all copyright notices. By downloading, you agree to these terms.
Related Documents