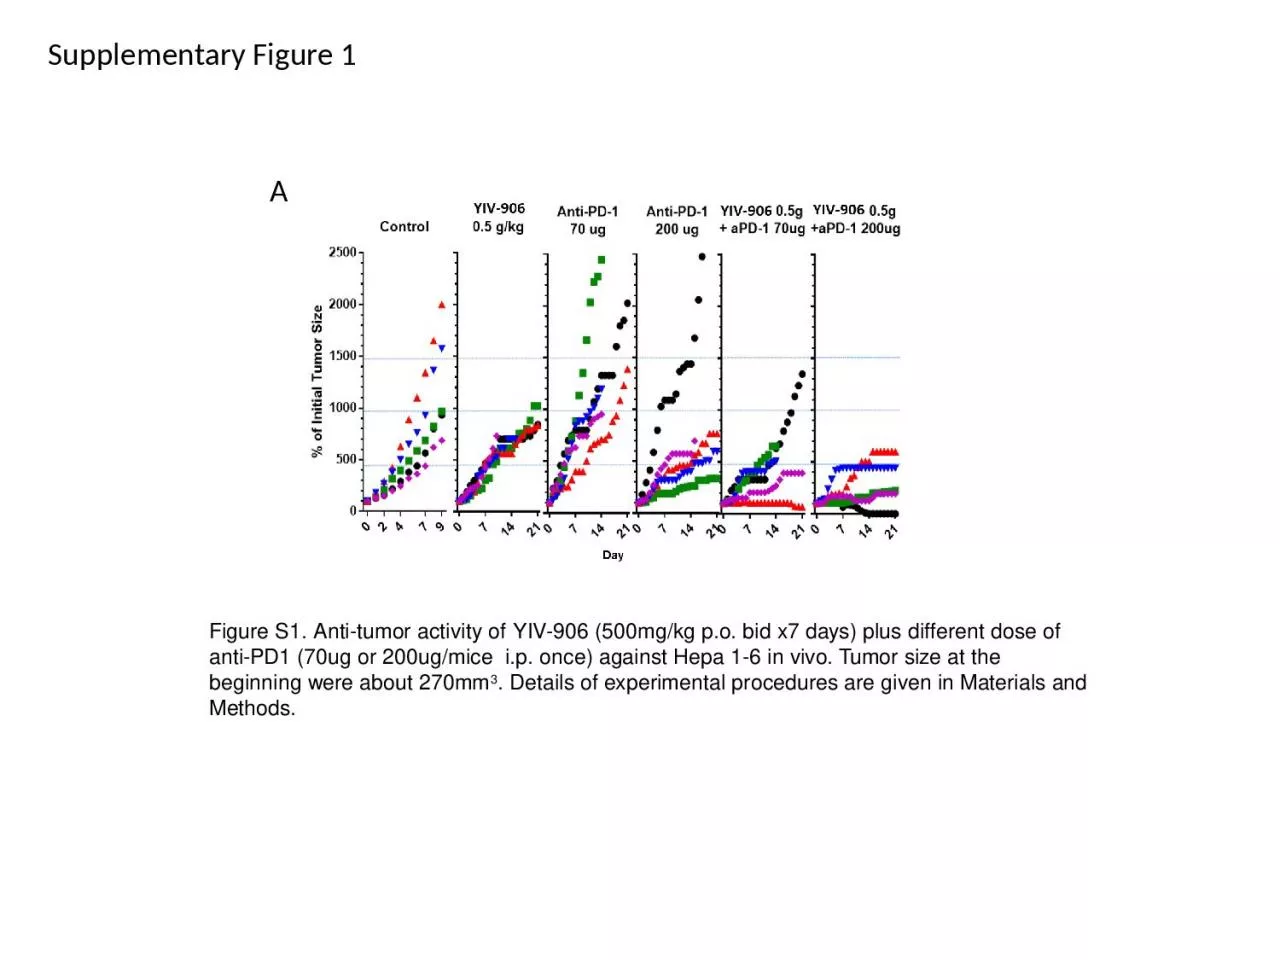
YIV906 500mgkg po bid x7 days plus different dose of antiPD1 70ug or 200ugmice ip once against Hepa 16 in vivo Tumor size at the beginning were about 270mm 3 ID: 919587
Download Presentation The PPT/PDF document "Supplementary Figure 1 Figure S1. Anti-t..." is the property of its rightful owner. Permission is granted to download and print the materials on this web site for personal, non-commercial use only, and to display it on your personal computer provided you do not modify the materials and that you retain all copyright notices contained in the materials. By downloading content from our website, you accept the terms of this agreement.
Slide1
Supplementary Figure 1
Figure S1. Anti-tumor activity of YIV-906 (500mg/kg p.o. bid x7 days) plus different dose of anti-PD1 (70ug or 200ug/mice i.p. once) against Hepa 1-6 in vivo. Tumor size at the beginning were about 270mm3. Details of experimental procedures are given in Materials and Methods.
A
Slide2H2AX
-P Cleaved Cas9 Cleaved Cas8 Cleaved Cas3Figure S2. Effect of YIV-906 and/or Anti-PD1 on apoptosis and DNA damage of Hepa
1-6 tumor. (A) Immunohistochemistry staining for cleaved caspase 3, 8, 9 for apoptosis and H2AX-ser139P
for DNA damage. (B to E). Quantification for
caspase 3, 8, 9 and H2AX-ser139P from (A).
Details of experimental procedures are given in Materials and Methods.
Supplementary figure 2
A
B C
D E
Control
YIV
-906 Anti-PD1
YIV-906+Anti-PD1
Slide3Figure S3. Effect of YIV-906 and/or Anti-PD1 on
Hepa 1-6 tumor growth in nude mice. Details of experimental procedures are given in Materials and Methods.Supplementary figure 3
Slide4A
B
C
D
E
F
G
H
Figure S4. Effect of YIV-906 and/or Anti-PD1 on inflammatory cytokines in plasma and tumor tissue. (
A-D
) Inflammatory cytokines MCP1, IL6,
TBFa
, IL10 were detected in plasma. (
E-H
) Inflammatory cytokines MCP1, IL6,
TBFa
, IL10 were detected in tumor. MCP1 and
TNFa
amount in the plasma are decreased by the treatment of anti-PD1 and can be further decreased by YIV-906, indicated that YIV-906 could decrease inflammatory cytokines in plasma. Fluorescence bead multiplex assay was used to determined cytokine/chemokine profiles.
Supplementary Figure 4
Slide5Figure S5. Effect of YIV-906 and/or anti-PD1 treatment on
iNOS (A) and Arg (B) protein in Hepa 1-6 tumor. (C) Western blot analysis for the iNOS, Arg1 protein expression of Hepa 1-6 tumor following 4 days treatment of Anti-PD1-/+YIV906. Histone H3 was used for normalization of protein loading. Each sample was normalized to a master mix sample (MIX) which loading duplicated in each gel. T-test P values were shown in the graph.
YIV-906+Anti-PD1group_3
Control_1
Control_2
Mix_1
Mix_2
YIV-906group_1
YIV-906group_2
YIV-906group_3
YIV-906group_4
YIV-906group_5
YIV-906group_6
YIV-906group_7
130
40
17
iNOS
Arg1
H3
Control_3
Control_4
Mix_1
Mix_2
Anti-PD1group_1
Anti-PD1group_2
Anti-PD1group_3
Anti-PD1group_4
Anti-PD1group_5
Anti-PD1group_6
Anti-PD1group_7
130
40
17
iNOS
Arg1
H3
130
40
17
Control_5
Control_6
Mix_1
Mix_2
YIV-906+Anti-PD1group_1
YIV-906+Anti-PD1group_2
YIV-906+Anti-PD1group_4
YIV-906+Anti-PD1group_5
YIV-906+Anti-PD1group_6
YIV-906+Anti-PD1group_7
Control_7
iNOS
Arg1
H3
Supplementary Figure 5
A
B
C
Slide6Figure S6. Effect of
YIV-906 and/or Anti-PD1 treatment on IFNα (A), IFNβ (B), IFNγ (C
) mRNA expression in Hepa 1-6 tumor. The mRNA expression of IFN
α
, IFN
β
and IFN
γ
were determined by RT-
qPCR
following treatment at day 4. T-test P values were shown in the graph.
Details of experimental procedures are given in Materials and Methods.
Supplementary figure 6.
A B C
Slide7Supplementary figure 7
Figure S7. Impact of YIV-906 on the proteins of the IFNg signaling pathway. (A) Western blot analysis for the effect of YIV-906GU on the action of IFNg on IFNg signaling of BMDMs. (B) Western blot analysis for the effect of YIV-906GU on the action of IL4 on IL4 signaling of BMDMs. Bone marrow cells were cultured in the presence of murine M-CSF (10ng/ml) for 7 days cultured and then IFNg 10ng/ml to induce polarization to M1-like macrophage while M2 like macrophage were induced by IL-4 20ng/ml for 24h with or without YIV-906. Portein expression or phosphorylation were detected with western blotting. Histone H3 was used for normalization of protein loading. Details of experimental procedures are given in Materials and Methods.
A B
Slide8Figure S8. Effect of YIV-906/GU on
IFNb and target genes expression of IFNg. Effect of YIV-906/GU in the presence of IFNg on mRNA expression of IL15RA and ICAM (downstream of IFNg). Bone marrow cells were cultured in the presence of murine M-CSF (10ng/ml) for 7 days, and then cultured with YIV-906/GU in presence or absent of IFNg 10ng/ml The mRNA expression were determined by RT-qPCR following treatment at day 8. Details of experimental procedures are given in Materials and Methods.Supplementary figure 8A B
Slide9Raw cell 264.7
Supplementary figure 9Figure S9. Effect of YIV-906 or YIV-906GU on the action of INFg to polarize Raw cell 264.7 into M1-like macrophage. 906 could potentiate IFNg to induce MCP1, TNFa and iNOS (M1 related genes). Raw cell 264.7 were cultured in the presence of murine M-CSF (10ng/ml) for 3 days, and then cultured in presence with IFNg 10ng/ml to induce polarization to M1-like macrophage for 24h. The mRNA expression were determined by RT-qPCR following treatment at day 8.