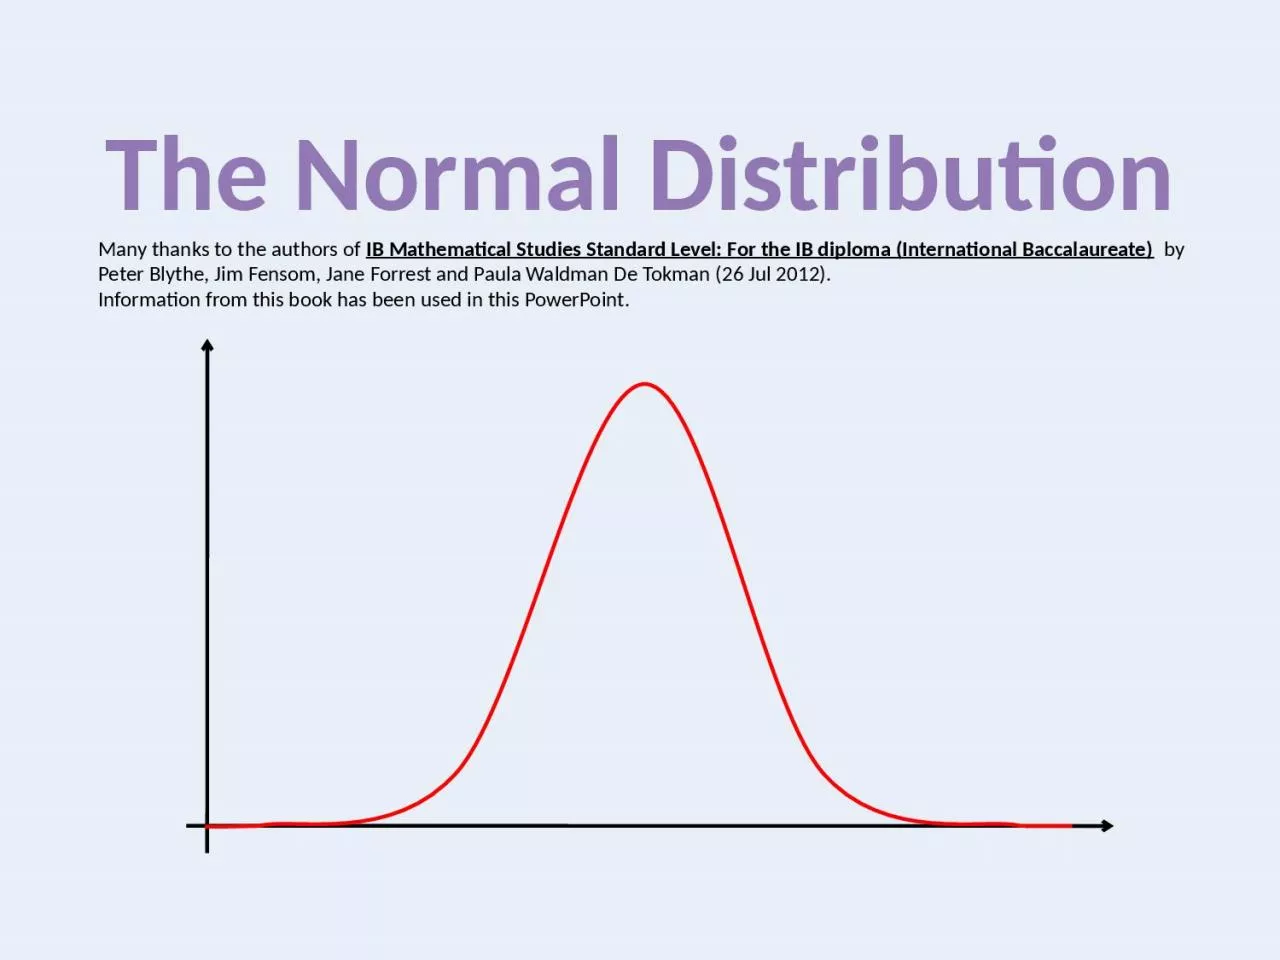
PPT-The Normal Distribution Many thanks to the authors of
Author : adia | Published Date : 2023-10-27
IB Mathematical Studies Standard Level For the IB diploma International Baccalaureate by Peter Blythe Jim Fensom Jane Forrest and Paula Waldman De Tokman 26
Presentation Embed Code
Download Presentation
Download Presentation The PPT/PDF document "The Normal Distribution Many thanks to t..." is the property of its rightful owner. Permission is granted to download and print the materials on this website for personal, non-commercial use only, and to display it on your personal computer provided you do not modify the materials and that you retain all copyright notices contained in the materials. By downloading content from our website, you accept the terms of this agreement.
The Normal Distribution Many thanks to the authors of: Transcript
IB Mathematical Studies Standard Level For the IB diploma International Baccalaureate by Peter Blythe Jim Fensom Jane Forrest and Paula Waldman De Tokman 26 Jul 2012 Information from this book has been used in this PowerPoint. History. Abraham de . Moivre. (1733) – consultant to . gamblers. . Pronunciation. .. Pierre Simon . Laplace – mathematician, astronomer, philosopher, determinist.. Carl Friedrich . Gauss – mathematician and astronomer.. Objectives:. For variables with relatively normal distributions:. Students should know the approximate percent of observations in a set of data that will fall between the mean and ± 1 . sd. , 2 . sd. Distributions. Definition. Many sets of data fit what is called a Normal Distribution: EG. . Examples when the Normal distribution arises. Looking at the national averages for NCEA.. When measuring heights, weights, arm spans, hand spans . 2.1 Density Curves and the Normal Distributions. 2.2 Standard Normal Calculations. 2. Histogram for Strength of Yarn Bobbins. X. X. X. X. X. X. X. X. X. X. X. X. X. X. X. X. X. X. X. X. X. X. X. X. Bobbin #1: 17.15 g/tex. Normal distribution. Lognormal distribution. Mean, median and mode. Tails. Extreme value distributions. Normal (Gaussian) distribution. P. robability density function (PDF). What does figure tell about the cumulative distribution function . The Normal Curve, Skewness, Kurtosis, and Probability. VON CHRISTOPHER G. CHUA, LPT, MST. Affiliate, ESSU-Graduate School. MAED 602: STATISTICAL METHODS. Session Objectives. In this fraction of the course on Statistical Methods, graduate students enrolled in the subject are expected to do the following:. State:. Express the problem in terms of the observed variable . x. .. Plan:. Draw a picture of the distribution and shade the area of interest under the curve.. Do:. Perform calculations.. Standardize. 68%-95%-99.7% Rule. Areas under Normal Curve. Areas under Normal Curve(cont). Example: Normal Distribution. The brain weights of adult Swedish males are . approximately. normally distributed with mean μ = 1,400 g and standard deviation . @UWE_JT9. @. dave_lush. Scientific . Practice. The Binomial Distribution. This distribution can be seen when the outcomes have discrete values…. eg. rolling dice. Assumptions…. Fixed . number of . Section 2.2. Normal Distributions. After this section, you should be able to…. DESCRIBE and APPLY the 68-95-99.7 Rule. DESCRIBE the standard Normal Distribution. PERFORM Normal distribution calculations. It is also known as the Gaussian distribution and the bell curve. .. The general form of its probability density function is-. Normal Distribution in . Statistics. The normal distribution is the most important probability distribution in statistics because it fits many natural phenomena. . Dehaish. Outlines. Normal distribution. Standard normal distribution . Find probability when known z score . Find z score from known areas . Conversion to Standard normal distribution.. Sampling distribution of sample mean . Normal random variables. The Normal distribution is by far the most important and useful probability distribution in statistics, with many applications in economics, engineering, astronomy, medicine, error and variation analysis, etc. The Normal distribution is often called the bell curve, due to its distinctive shape.. ). Let x. i. ~ N(. μ. i. , σ), then the probability density function is defined as. :. Letting: are . independent identical distributed with normal distribution, then the joint distribution of .
Download Document
Here is the link to download the presentation.
"The Normal Distribution Many thanks to the authors of"The content belongs to its owner. You may download and print it for personal use, without modification, and keep all copyright notices. By downloading, you agree to these terms.
Related Documents