PPT-4.4 Graphing sin and cos Functions
Author : alexa-scheidler | Published Date : 2018-11-07
5Minute Check 1 Let 5 12 be a point on the terminal side of an angle θ in standard position Find the exact values of the six trigonometric functions of θ Let
Presentation Embed Code
Download Presentation
Download Presentation The PPT/PDF document "4.4 Graphing sin and cos Functions" is the property of its rightful owner. Permission is granted to download and print the materials on this website for personal, non-commercial use only, and to display it on your personal computer provided you do not modify the materials and that you retain all copyright notices contained in the materials. By downloading content from our website, you accept the terms of this agreement.
4.4 Graphing sin and cos Functions: Transcript
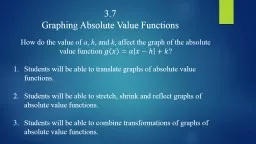
5Minute Check 1 Let 5 12 be a point on the terminal side of an angle θ in standard position Find the exact values of the six trigonometric functions of θ Let . Eraser Game. !. A boat traveled 210 miles downstream and back. The trip downstream took 10 hours. The trip back took 70 hours. What is the speed of the boat in still water? What is the speed of the current?. : Core-Content Area Report . Erica Sisk. Fall 2011. When teaching students about the properties of circles, a technology that is very useful for discovering these properties is Geometer’s Sketchpad. Teachers can assign the students pre-packaged assignments from the Geometer’s Sketchpad resources located on the interactive disc or create assignments from scratch. . Page 1 of 2 Graphing the Equation of a Translated Circle\r\f!\r\b\r\b\r\r\t\b\b\t\r\r\b\b\t\n9:\b\r\r\r\f\n\r\r Exponential and Logarithmic Functions and Equations. 5.1 Exponential Functions. 5. .2 The Natural Exponential Function. 5.3 Logarithmic Functions. 5.4 Properties of Logarithms. 5.5 Exponential and Logarithmic Equations . University of Michigan – Dearborn Science Learning Center. Based on a presentation by James . Golen. Revised by Annette . Sieg. …. Introduction. Before using this module you must already understand the basics of graphing (e.g., identifying dependent and independent variables, plotting data points). . Objectives: Identify Polynomial functions. Determine end behavior recognize characteristics of polynomial functions. Use factoring to find zeros of polynomial functions.. Polynomials of degree 2 or higher have graphs that are smooth and continuous. By smooth we mean the graphs have rounded curves with no sharp corners. By continuous we mean the graphs have no breaks and can be drawn without lifting your pencil from the rectangular coordinate system.. Evaluating Rational & Irrational Exponents. Graphing Exponential Functions . f(x) = a. x. Equations with . x. and . y. Interchanged. Applications of Exponential Functions. Use calculators to calculate graphing points. Chapter 8/9 Notes. Part II. 8-5, 8-6, 8-7, 9-2, 9-3. Section 8-5: Greatest Common Factor, Day 1. Factors –. Factoring – . Standard Form Factored Form. Section 8-5: Greatest Common Factor, Day 1. How do the value of . a. , . h. , and . k. , affect the graph of the absolute value function . ?. Students will be able to translate graphs of absolute value functions.. Students will be able to . stretch, shrink and reflect graphs of absolute value functions.. Now, we have learned about several properties for polynomial functions. Finding y-intercepts. Finding x-intercepts (zeros). End behavior (leading coefficient, degree). Testing values for zeros/factors (synthetic division) . Objectives:. To approximate . x. -intercepts of a polynomial function with a graphing utility. To locate and use relative . extrema. of polynomial functions. To sketch the graphs of polynomial functions. transformations of these graphs. LO: SWBAT state the transformations of the sine and cosine. Graphs in words.. CO: SWBAT generate the graphs of the sine and cosine functions and explore various . transformations of these graphs. LO: SWBAT state the transformations of the sine and cosine. Sin 0°= . Sin . = . Sin . π. =. Sin . =. Sin 2. π. =. . Chapter 4. Graphs of the Circular Functions. Section 4.1. . Graphs . of the Sine and . Cosine . Functions. Objective:. SWBAT graph the sine and cosine functions with variations in amplitude and periods. . Scientist interpret tables, graphs, and diagrams to locate data, examine relationships in the data, and extend those relationships beyond the data.. Reading graphs can be like reading a foreign language though. It come easy to some and very difficult to others..
Download Document
Here is the link to download the presentation.
"4.4 Graphing sin and cos Functions"The content belongs to its owner. You may download and print it for personal use, without modification, and keep all copyright notices. By downloading, you agree to these terms.
Related Documents