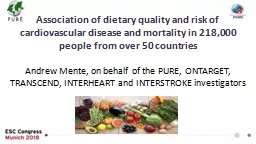
/
Fruit, vegetable and legume intake and CVD and deaths: the Prospective Urban Rural Epidemiology Fruit, vegetable and legume intake and CVD and deaths: the Prospective Urban Rural Epidemiology

Fruit, vegetable and legume intake and CVD and deaths: the Prospective Urban Rural Epidemiology - PowerPoint Presentation

alexa-scheidler
alexa-scheidler . @alexa-scheidler
Follow
342 views
Uploaded On 2019-11-06

Fruit, vegetable and legume intake and CVD and deaths: the Prospective Urban Rural Epidemiology - PPT Presentation

Fruit vegetable and legume intake and CVD and deaths the Prospective Urban Rural Epidemiology PURE study of 135335 people in 18 countries Andrew Mente on behalf of the PURE investigators ID: 763666

mortality intake trend cvd intake mortality cvd trend day vegetable fruit servings major risk total legume countries 335 135

Share:

Link:

Embed:

Download Presentation from below link

Download Presentation The PPT/PDF document "Fruit, vegetable and legume intake and C..." is the property of its rightful owner. Permission is granted to download and print the materials on this web site for personal, non-commercial use only, and to display it on your personal computer provided you do not modify the materials and that you retain all copyright notices contained in the materials. By downloading content from our website, you accept the terms of this agreement.


Presentation Transcript

Fruit, vegetable and legume intake and CVD and deaths: the Prospective Urban Rural Epidemiology (PURE) study of 135,335 people in 18 countriesAndrew Mente, on behalf of the PURE investigators

Duality of InterestsNone to declare with regards this presentation

Background Dietary guidelines recommend at least 5 daily servings (≥400 g) of fruits, vegetables and legumes Associated with lower risk of CVD and mortality, but could be influenced by health seeking behaviors - Few data from South America, Middle East, Africa and South Asia; Most data from N Amer , Europe, China, Japan Recommendations do not differentiate between raw and cooked vegetable intake

AimsTo assess the association between fruit, vegetable and legume consumption and cardiovascular disease and mortality in 135,335 individuals in 18 countries

Study Methods Design: Prospective cohort study Population: Unbiased selection from general population in 667 urban/rural communities in 18 countries N=135,335; aged 35-70 years, without CVD at baseline Exposure: Country-specific, validated food frequency questionnaires Covariates: Demographics, other lifestyle, health history, center Outcomes: Major CVD (CV death and nonfatal MI, stroke, and heart failure) (n=4784), using standardized definitions; total mortality (n=5796) Follow-up: Median 7.4 years

PURE: 135,335 from 667 communities in 18 Phase 1 countries from 5 continents Target: 200,000 people

Countries Geographic region Countries N South AsiaBangladesh, India, Pakistan 29,560ChinaChina 42,152 Southeast Asia Malaysia 10,038 Africa South Africa, Zimbabwe 4,558North America Canada, Poland, Sweden, 14,916Middle East Iran, Occupied Palestinian Territory, Turkey, United Arab Emirates 11,485 South America Argentina, Brazil, Chile, Colombia 22,626 Overall 135,335

Missing follow-up (0.9%) Implausible values (1.9%) Energy <500 or >5000 kcal/d N=143,934 N=142,704 N=135,335 Baseline CVD (5.2%) Phase-1 participants included in these analyses N=146,646 completed FFQ N=157,543 participants from 18 countries Did not complete an FFQ (6.9%)

Statistical MethodsStudied time to eventsMultivariable Cox frailty analysis with random intercepts to account for correlation of observation within centersAdjusted for: Age, sex, urban/rural locationEducation, smoking, physical activity, diabetesEnergy intake, meats, bread & cerealWhen reporting fruit, adjust for vegetables, and vice-versa

Mean fruit, vegetable and legume intake by region

Risk of mortality by total fruit, veg & legume intake Servings/day N No. of deaths (%) Age & sex adj.Full adjusted <1 /day 9082 736 (8.1%) 1.0 (ref) 1.0 (ref) 1 to <2 /day 190361371 (7.2%) 0.92 (0.84-1.01)1.01 (0.91-1.12) 2 to <3 /day 35128 1529 (4.4%) 0.81 (0.74-0.89) 0.91 (0.82-1.01) 3 to <4 /day 24485 772 (3.2%) 0.65 (0.58-0.74) 0.78 (0.69-0.88) 4 to <5 /day 14849 468 (3.2%) 0.65 (0.58-0.74) 0.83 (0.72-0.95) 5 to <6 /day 9790 286 (2.9%) 0.62 (0.53-0.71) 0.78 (0.66-0.91) 6 to <8 /day 6945 198 (2.9%) 0.63 (0.54-0.75) 0.84 (0.70-1.00) 7 to <8 /day 4857 131 (2.7%) 0.61 (0.50-0.74) 0.83 (0.67-1.02) >8 /day 11163 305 (2.7%) 0.58 (0.50-0.74) 0.81 (0.68-0.96) P for trend <0.0001 0.0001

Risk of mortality and major CVD by total fruit, vegetable and legume intake (servings/day) Mortality Major CVD P-trend=0.0001 Intake HR (95% CI) 1 1.2 0.8 0.6 P-trend=0.13 Intake HR (95% CI) 1 1.2 0.8 0.6 1.4

Risk of mortality and major CVD by fruit intake (servings) Mortality Major CVD P-trend<0.0001 P-trend=0.11 Intake HR (95% CI) 1 1.2 0.8 0.6 Intake HR (95% CI) 1 1.2 0.8 0.6

Risk of mortality and major CVD by vegetable intake (servings/day) Mortality Major CVD P-trend=0.12 P-trend=0.38 Intake HR (95% CI) 1 1.2 0.8 0.6 Intake HR (95% CI) 1.2 1.4 1 0.8

Mean raw and cooked vegetable intake by region Excluding China ( N=42,152)

Risk of mortality and major CVD by raw vegetable intake (servings)Mortality Major CVD Excluding China P-trend=0.0004 P-trend=0.27 Intake HR (95% CI) 1 1.2 0.8 0.6 Intake HR (95% CI) 1 1.2 0.8 0.6

Risk of mortality and major CVD by cooked vegetable intake (servings) Mortality Major CVD Excluding China P-trend=0.011 P-trend=0.085 Intake HR (95% CI) 1 1.2 0.8 0.6 Intake HR (95% CI) 1 1.2 0.8 1.4

Risk of mortality and major CVD by legume intake (servings) Mortality Major CVD P-trend=0.0013 P-trend=0.19 Intake HR (95% CI) 1 1.2 0.8 0.6 Intake HR (95% CI) 1 1.2 0.8 0.6

Conclusions Fruit, vegetables and legumes associated with a moderately lower risk of mortality, but not CVD Benefits appear to reach a maximum versus mortality at 3 to 4 daily servings (375 g) Raw vegetables appear to be more protective than cooked vegetables A balanced diet of >3-4 daily servings fruit, vegs. and legumes is associated with lower mortality

EXTRAS

Total fruit, vegetable and legume intake vs. mortality1.2 1.00.6 0.801 982 345 6 7 HR Servings/day

Mean contribution of fruit type to total fruit intake

Mean contribution of vegetable type to total vegetable intake Excluding China (N=42,152) because FFQ did not collect vegetable intake by type

Risk of MI and stroke by total fruit, vegetable and legume intake (servings/day) Myocardial Infarction Stroke N=9,082 N=19,032 N=35,128 N=24,485 N=14,849 N=9,790 N=6,945 P-trend=0.71 P-trend=0.20 N=4,857 N=11,163

Risk of CV and non-CV mortality by total fruit, vegetable and legume intake (servings/day) CV mortality Non-CV mortality N=9,082 N=19,032 N=35,128 N=24,485 N=14,849 N=9,790 N=6,945 P-trend=0.0038 P-trend=0.057 N=4,857 N=11,163

Risk of total mortality by tertiles of total fruit, vegetable and legume intake (servings/day), by region

PURE: 195,000 from 1000 communities in 26 countries from 5 continents