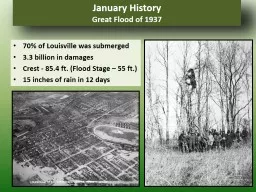
70 of Louisville was submerged 33 billion in damages Crest 854 ft Flood Stage 55 ft 15 inches of rain in 12 days Chapter 1 Monitoring the Weather Basics One of the Deepest Extratropical Cyclones Ever Recorded ID: 627587
Download Presentation The PPT/PDF document "January History Great Flood of 1937" is the property of its rightful owner. Permission is granted to download and print the materials on this web site for personal, non-commercial use only, and to display it on your personal computer provided you do not modify the materials and that you retain all copyright notices contained in the materials. By downloading content from our website, you accept the terms of this agreement.
Slide1
January HistoryGreat Flood of 1937
70% of Louisville was submerged3.3 billion in damagesCrest - 85.4 ft. (Flood Stage – 55 ft.)15 inches of rain in 12 daysSlide2
Chapter 1: Monitoring the Weather (Basics)
One of the Deepest Extratropical Cyclones Ever RecordedSlide3
Difference between Weather and Climate
Weather
is the state of the atmosphere at some place and time
Described with quantitative variables
Temperature, humidity, cloudiness, precipitation, wind speed, wind direction
Meteorology is the study of the atmosphere and the processes that cause weather
Climate
is weather conditions at some locality averaged over a specified time period
Climate is an average of the weather, figured over the last 30-years and updated every decade
A locale’s climate also includes weather extremesSlide4
Look at Climatological InformationSlide5
Sources of Weather Information
Television
The Weather Channel
and local newscasts
Radio
NOAA Weather Radio
Continuous broadcasts
repeated every 4 - 6 minutes
Interrupted with warnings
and watches
The Internet (Ag Weather)
What about now?
Survey of Farmers at the 2013 National Farm Machinery ShowSlide6
Early Days in Ag Weather
Green Thumb – Brought on demand market, futures, and weather information.
100 farmers in 2 counties as a pilot project. Viewed on televisions by accessing county computers using a telephone line
Keypad allowed farmers the option to choose what they wanted to view.
AGTEXT - Worked
with KET to distribute closed captioning information to anyone across
Kentucky. Forecasts
were updated real
time.
Netscape
in the 1990s, before the World Wide Web became establishedSlide7
Retrieving Weather Information & Maps
Weather info received via TV,
radio, or the Internet includes
Weather maps
National
Regional
Satellite/radar images
Data on current/past
conditions
Weather forecasts
Short-term
24 – 48 hours
Long-term
Up to 7 days or longerSlide8
GOES-R
Much higher resolution
Can scan areas for severe weather every 30 secondsAlso detects lightning strikes
Not fully operational until
November.
22,300 miles highSlide9
Two Types of Pressure Systems
High Pressure
Systems, or
“Anticyclones”
Low Pressure
Systems, or
“Cyclones”Slide10
Pressure Systems Cont.
High and low refer to air pressure
High pressure area is relatively high compared to surrounding air
Low pressure area is relatively low compared to surrounding air
Highs
Fair weather
Clockwise rotation of sinking air (in Northern Hemisphere)
Generally track toward the east and southeast
Lows
Stormy weather
Counterclockwise rotation of rising air (in Northern Hemisphere)
Generally track toward the east and northeast
Lows tracking across the northern U.S. or southern Canada produce less moisture than lows tracking across the southern U.S.
Weather to the west and north – usually cold
Weather to the south and east – usually warmSlide11
Pressure Systems Cont.(High and Low Pressure Centers)
Arrows indicate surface horizontal windsSlide12
Pressure Systems Cont.(What’s the weather like?)
1. Tallahassee, FL
2. Greenville, NC3. Duluth, MN4. Scranton, PA
Wind Direction?
Cloudy/Wet, Clear/Dry?Slide13
Air Masses
Huge volume of air covering thousands of square kilometers
Horizontally relatively uniform in characteristics
Temperature
Humidity
Gathers characteristics from its source region
Cold, dry air masses form at higher latitudes over continents
Cold, humid air masses form at higher latitudes over maritime surfaces
Warm, dry air masses form over continents in subtropical regions
Warm, humid air masses form near the equator or in the subtropics over maritime surfacesSlide14
Air Masses Across North America
Old Saying in the Ohio Valley:
“Don’t like the weather today?It will change tomorrow!”Slide15
Fronts
“Transition Zones between Air Masses”
Warm Air Rising
Warm Front
Cold FrontSlide16
Fronts – Boundary Between Air Masses
Cold Front
Generally, a narrow band of precipitation along or just ahead of the surface front, where precipitation is brief (couple of minutes to a few hours)
Precipitation can be severe
Boundary between advancing cold air and retreating warm air
Plotted on a map as a blue line with triangles pointed in the direction of motion
Sharp Temperature ChangeSlide17
Fronts – Boundary Between Air Masses
2. Warm Front
Generally, a wide band of precipitation along or just ahead of the surface warm front, where precipitation can be persistent (12-24 hours)
Precipitation is generally light to moderate
Boundary between advancing warm air and retreating cold air
Plotted on a map as a red line with semi-circles pointed in the direction of motionSlide18
Fronts – Boundary Between Air Masses
Right - A
cyclone
with the warm and cold fronts extending outward from the low pressure center. Showers generally form along the warm front, while more severe weather can occur along the cold front.
Left - Shows
how the warm and cold fronts act as boundaries between different air masses. Notice how the wind directions are different on either side of the fronts, and that the flow is counterclockwise and convergent. Slide19
Ways to Locate a Front on a Surface Weather Map
Precipitation
Cloud Cover
Wind Shift
Temperature Difference
Dew Point
DifferenceSlide20
Other Types of Frontal Boundaries
Stationary
– a non-moving front where winds on either side blow in opposite directions. Can become a cold or warm front based on advection.
2. Occluded
– when the air behind the cold front overtakes the air ahead of the warm frontSlide21
Characteristics of Air Masses & Fronts
Wind directions are different on the two sides of a front
Some fronts have no clouds or precipitation.
Passage indicated by wind shift, and temperature/humidity changes
In summer, temperature can be nearly the same on both sides of a cold front
Difference will be humidity
Fronts are anchored to lows on a weather map.
Counterclockwise flow brings contrasting air masses together to form fronts
Thunderstorms/severe weather often occur in the warm, humid air mass located between the cold and warm frontSlide22
Describing the State of the Atmosphere
What do Forecasters Tell Us?
Maximum Temperature
Usually occurs in early to mid-afternoon
Minimum temperature
Usually occurs around sunrise
Dewpoint (frost point)
The temperature at which air must be cooled at constant pressure to become saturated with water vapor and for dew (or frost) to form
Higher Dewpoint = More Moisture
Relative humidity
A percentage; the ratio of the actual concentration of the water vapor component of air compared to the concentration the air would have if
saturated
with water vapor
Relative humidity will change throughout the day as the temperature varies
Generally highest around sunrise and lowest when warmest
Precipitation amounts
General rule – 10” of snow = 1” of precipitationSlide23
Example: More about RH and
Dew Point
Dew Point Temp F
Human Perception
R. Humidity
75 +
Extremely uncomfortable, oppressive
62%
70-74
Very Humid, quite uncomfortable
52-60%
65-69
Somewhat uncomfortable for most people
44-52%
60-64
OK for most
37-46%
55-59
Comfortable
31-41%
50-54
Very comfortable
31-37%
49 or lower
Feels like the western US
30%
Livestock Cold Stress?
None
Danger
EmergencySlide24
Describing the State of the
Atmosphere Cont.What do Forecasters Tell Us?
Air Pressure
And its tendency (rising or falling)
Falling may indicate approaching
cold front
Wind direction and speed
Wind direction is the direction wind
is blowing from
Example; a west wind is blowing from the west, toward the east
Sky cover
Fraction of the sky covered in clouds
NWS Weather watch
– issued when hazardous weather is considered possible
NWS Weather warning
– issued when hazardous weather is imminent or actually taking placeSlide25
Weather Satellite Imagery
Two major types of satellite orbits
Geostationary
High orbits
36,000 km (22,300 miles) high
Orbits planet at same rate as Earth’s rotation and in same eastward direction
Currently 2 of these provide a complete view of much of N. America and adjacent oceans to latitudes of about 60 degrees
Positioned over equator at 75
0
W longitude, 135
0
W longitude
Low angle in polar regions
Polar orbiting
Low orbits800-1000 km (~500-600 miles) high (Much more detailed info)Provides overlapping north-south strips of images
Passes over the same point twice every 24 hoursSlide26
Orbits of Each Type of Satellite
Geostationary Satellite
Polar Orbiting SatelliteSlide27
Weather Satellite Imagery
Visible
Black and white photograph of the planet
Only available during daylight hours
Highly reflective surfaces appear bright white and less reflective surfaces are darkerSlide28
Weather Satellite Imagery
Infrared
Available anytime, not just during daylight
Provides temperature comparison of features within image
Colder = Bright
Warmer = Dark
Lower Altitude= Gray
Higher altitude =Bright colorsSlide29
Weather Satellite Imagery
Water vapor imagery
Enables tracking of plumes of moisture
Shades of white = increasing moisture
Upper-level clouds appear milky to bright whiteSlide30
Weather Radar
Complements satellite surveillance
Doppler radar detects movement
Excellent tool to forecast tornadoesSlide31
Understanding UTC Time
Weather observations are taken across the world based on a standard time.
In doing so, a 24 hour clock is used, similar to military time.
UTC (
Coordinated Universal Time or Universal Time
Coordinated)
Also called “Z Time”
To get local time in the United States, you have to subtract a certain number of hours based on time zone.
Daylight Savings Time does make a differenceSlide32
Understanding UTC Time
UTC Time = 1200 UTC
Daylight Savings Time?
(Not until March 8
th
)
No
-5 Hours for EST
= 7 AM
18 UTC = 18Z = ?
00 UTC = 0Z = ?
06 UTC = 6Z = ?