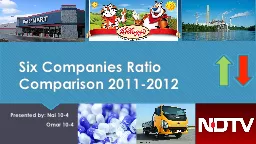
/
Six Companies Ratio Comparison 2011-2012 Six Companies Ratio Comparison 2011-2012

Six Companies Ratio Comparison 2011-2012 - PowerPoint Presentation

alexa-scheidler
alexa-scheidler . @alexa-scheidler
Follow
397 views
Uploaded On 2016-04-10

Six Companies Ratio Comparison 2011-2012 - PPT Presentation

Presented by Nai 104 Omar 104 WalMart Stores Inc 20112012 WalMart Store Inc Year 1 Year 2 Gross Profit Ratio 2534 2501 Net Profit Ratio 388 351 ID: 277806

company profit ratio year profit company year ratio gross 2012 2011 current high rate percentage net assets amount chose

Share:

Link:

Embed:

Download Presentation from below link

Download Presentation The PPT/PDF document "Six Companies Ratio Comparison 2011-2012" is the property of its rightful owner. Permission is granted to download and print the materials on this web site for personal, non-commercial use only, and to display it on your personal computer provided you do not modify the materials and that you retain all copyright notices contained in the materials. By downloading content from our website, you accept the terms of this agreement.


Presentation Transcript

Slide1

Six Companies Ratio Comparison 2011-2012

Presented by: Nai 10-4 Omar 10-4Slide2

Wal-Mart Stores Inc. 2011-2012

Wal-Mart Store Inc.

Year 1

Year 2

Gross Profit Ratio

25.34%25.01%

Net Profit Ratio

3.88%3.51%

R.O.C.E

34.34%

34.21%

Current Ratio0.890.88Gearing Ratio35.88%35.90%Acid Test Ratio0.270.23

-0.33

-0.37

-0.13

-0.1

+0.02

-0.04Slide3

Analysis:

Wal-Mart Stores, which is an American multinational retail corporation of large amount of discount department stores and warehouse store, did poorly in the year 2011-2012 for many reasons. Its gross profit is very low. It does not attain the specified rate of retail which is 44%. It is only around 25%. It typically fine for the retailing. It possess only 25.34%, and slightly drops down to 25.01%. They lose 0.33%. The reason could be that they highly outlay their money on their product, and they did not get enough amount of money because people don’t appreciate it. The marketing and advertising department of the store take the responsibility of increasing the sales rate, so they would get massive amount of profit.

Their net profit ratio are extremely low. It should be at least 9-10%. Their percentage goes down from 3.88% to 3.51%. Less amount of profit is not sufficient to run the business on. They have to lessen their expenses, which could be utility bills, wages, depreciation and advertisement

. The R.O.C.E rate moves down very less from 34.44% to 34.21%. Its current ratio just descends 0.01, which are very exiguous. It could be that they have well-maintained standpoint of asset more than liabilities (short-term loan, account payable, accrued liabilities). Its gearing ratio increase from 35.88% to 35.90%. It indicates that an increasing 0.02% comes from more

debts. Financially, the acid test ratio fade down 0.04. It reveals that their assets could not proficiently turned in as the form of money. Slide4

Kellogg Company 2011-2012

Kellogg Company

Year 1

Year 2

Gross Profit Ratio

43.09%

39.03%

Net Profit Ratio

10.38%6.56%

R.O.C.E

82.94%

65.92%Current Ratio0.920.93Gearing Ratio56.85%58.36%Acid Test Ratio0.58

0.57

-4.06

-3.82

-17.02

+0.01

+1.51

-0.01Slide5

Analysis

Kellogg Company is an American multinational food manufacturing company headquartered in 

Battle Creek, Michigan, United States. It produces cereal and convenience foods. Kellogg has the very good financial report. Its gross profit ratio stays at 43.09%, which is about 20

% much more away from the proper manufacturing gross profit varies in between 25%-35%. In year 2012, it falls to 39.30% because of fewer interest in their product. They have to find such a way to fix it in order maintain the large amount of profit they get during the first year. They can invent new taste, design of their food products or extenuate the capital cost, but still do well of sustaining the quality.

Its net profit is virtually 15%-20% in the first year, which is very high. Unfortunately, the percentage drops down to 6.56%. Stock that is left unsold, expenses or low selling price could possibly be reasons why it drops. Its R.O.C.E is gainful to all investors as a return. They should take an investment or hold a share of it. It is noticeably high with rate 82.94% and 65.92%.

The current ratio goes up just 1% from the first year to the second year. It is because of the exceeding assets (cash, inventory, account receivable) that prevails the liabilities. The gearing ratio are too high for both years, 56.85% and 58.36%. They need to lessen the bank loan, mortgage and debentures of the necessary assets in the company. Finally, the good acid ratio is more than 1. In the first year, they get 0.58. In the second year, they get 0.58. Both of these two rate are more than half of 1, which portrays that they still have a

bit high assets which could be changed to cash quickly.Slide6

Dominion Resources Inc. 2011-2012

Dominion

Resources Inc.

Year 1

Year 2

Gross Profit Ratio

31.86%22.24%

Net Profit Ratio

9.95%

2.30%

R.O.C.E

19.26%4.7%Current Ratio0.780.66Gearing Ratio45.00%43.19%Acid Test Ratio0.59

0.50

-9.62

-7.65

-14.56

-0.12

-0.09

-1.81Slide7

Analysis

Dominion Resources Inc. is the power and energy company headquartered in Richmond, Virginia that supplies electricity in parts of Virginia and North Carolina and supplies natural gas to parts of West Virginia, Ohio, Pennsylvania, and eastern North Carolina.

Its gross profit is half of the 54%, which is the required percentage of an electricity company. The gross profit ratio slides down from 31.86% to 22.24%. It might be the reason of good sold decreasing, or setting the selling price of the products too high. Its net profit ratio after excluding taxes and expenses are quite normal in the first year. In the second year, it obviously loses huge amount of profit, which is 7.65% down. The company are in critical stage, which the company might be able to bankrupt and eventually unable to run the business on if they are still imprudent with the expenses. The return of capital employed in the first year is good. The second year is completely unprofitable to all the investor to hold the stock as 4.7%. It is a very tiny amount of return.

Whatsoever, the current ratio is okay with 0.78 and 0.66 in both years. However they are still required to keep this good going status to the progressive level by controlling the current liabilities and enhancing the current assets. The gearing ratio in the first year is more than the second year, which is a good sign of being able to decrease the long-term

debts. Lastly, The acid test ratio percentage is the moiety of the suitable rate, which is 1. It only fades down 0.09. The percentage, 0.59 and 0.5 show that there are enough assets and stocks that could be turned as money promptly.Slide8

CiplaSlide9

Analysis

In 2011, Cipla, the leader in pharmaceutical industry, has invested in a lot of assets .The company standouts would make a very enormous amount of profit for 2011-2012 a plethora of reasons –

Its gross profit is the highest compared to previous years. Its gross profit went from 99.62 to a staggering 100.76%. This means that their profit before tax and by excluding there expenses. This company is doing remarkably well. The R.O.C.E for Cipla, which is 1.71% had increased just a tad bit to 1.72%. From this perspective, we can analyze that Cipla has plenty of assets that they utilized as it results in the overcoming of debts. Which may possibly be in a variety forms.Slide10

New Delhi Television LimitedSlide11

Analysis

Things are not looking so good for New Delhi Television Limited because Of three main reasons. The gross profit has never been at such an all time low right until 2012. New Delhi Television Limited’s Gross Profit has dropped from 2011(27.09%) to 2012(4.28%).

It’s net profit has also decreased significantly, which may contribute to the drop the gross profit. It’s current ratio has also dropped from 83.99(2011) to 78.98 (2012) which may account for the drop in gross profit and net profit. Slide12

TATA InvestmentSlide13

Analysis

In 2012,Tata investment, a subsidiary of Tata automobiles, has the highest current ratio (260.13%) as of 2012 The Company has a very stable percentage of rate of the ratios. Which is inevitable compared to the year 2011. Its percentage had increased by 239.84%. The reasons may be because their consumers, or rather investors in this case, may not be investing and using their services, which could account for the dropped in their gross profit.

The deciding factor in the company’s well-being might be inevitable, partially because the company’s profit is increasing, the company maybe lacking shareholders or investors which had invested in the company. Slide14

Why We Chose Cipla

This company has the highest percentage, and it is Cipla company because of the R.O.C.E and gross profit rate.It

tells us that the company is stable and doing well during the 2-year period which also indicates that the companies revenue would also be high. In 2011, the company’s gross profit was at a very high percentage, (99.62%). In 2012, the company’s gross profit was 100.76% and rose by 1.14%, the reason maybe that the company has came out with a new product or new services which may account for the increase, thus resulting in the increase of GP. Its profit before tax and after are incredibly high and its return rate is very high for the company’s investors which are interested in buying shares of the company.

When we essentially conducted a ratio analysis on the company, we found out that the company’s R.O.C.E remained the same during the two year period. Its NP Ratio also had a gain during the 2 years. Slide15

The Project Plan

Name

Tasks

Dateline

NaiFinding Three Balance Sheets

Finding Three Profit and Loss AccountsDoing Three Ratio AnalysisPowerPoint Presentation

-Graphs -Pictures

-Comparison of three companies -Recommendation

Finished (03/01/14)Finished (03/01/14)

Finished (04/01/14)

Finished (17/01/14)

OmarFinding Three Balance SheetsFinding Three Profit and Loss AccountsDoing Three Ratio AnalysisPowerPoint Presentation - Graphs - Organization of slides -Comparison of three companies -Why we choose company? Finished (02/01/14)Finished (02/01/14)Finished (04/01/14)Finished (17/01/14)Slide16

Reasons for Choosing Companies

Nai > I chose Wal-Mart stores Inc. as one of my company because I want to know how much Wal-Mart gains and loses their profit since they are the largest retailer of the world and biggest grocery store in the United States.

> I chose Kellogg Company with the reason it was my favorite cereal brand when I was a child. I wanted to know if people still consume the products and how much profit the company get. > I chose Dominion Resources Inc. because I have never heard the name of this company. I want to get acquainted with this energy supplier company and know their income statement.

Omar > I chose Cipla Company because as my will to the future, I would like to be a pharmacist, so I think it is beneficial for me to know the financial statement of pharmaceutical company if I’m going to work there in the financial department. > I chose Tata Motors Company because I’m interested in a truck. Also, my grandfather uses Tata truck in the countryside. I want to know to the circulation of this company.

> I chose New Delhi Television Company to see how much can news business get into people’s daily life. Slide17

Prepared By

Omar Ahmed & Chatchapol Atikhamanon

Thank you For Your Time