/
Color Magnitude Diagram Color Magnitude Diagram

Color Magnitude Diagram - PowerPoint Presentation

alida-meadow
alida-meadow . @alida-meadow
Follow
398 views
Uploaded On 2017-07-18

Color Magnitude Diagram - PPT Presentation

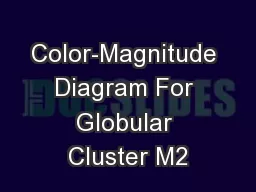
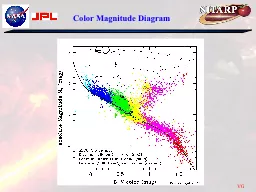
VG So we want a color magnitude diagram for AGN so that by looking at the color of an AGN we can get its luminosity But AGN have no fusion why would we expect a colormagnitude relation The gas that accretes onto the black hole is still hot and so must follow the Blackbody Radiation law ID: 571088

color agn galex sdss agn color sdss galex magnitude gas radiation sky survey black diagram law galaxy optical data

Share:

Link:

Embed:

Download Presentation from below link

Download Presentation The PPT/PDF document "Color Magnitude Diagram" is the property of its rightful owner. Permission is granted to download and print the materials on this web site for personal, non-commercial use only, and to display it on your personal computer provided you do not modify the materials and that you retain all copyright notices contained in the materials. By downloading content from our website, you accept the terms of this agreement.


Presentation Transcript

Slide1

Color Magnitude Diagram

VGSlide2

So we want a color magnitude diagram for AGN so that by looking at the color of an AGN we can get its luminosity

But AGN have no fusion, why would we expect a color-magnitude relation?

The gas that accretes onto the black hole is still hot and so must follow the Blackbody Radiation law.

VGSlide3

VG

Black Body radiation from both the gas and the dustSlide4

VG

Black Body radiation from both the gas and the dustSlide5

So we want a color magnitude diagram for AGN so that by looking at the color of an AGN we can get its luminosity

But AGN have no fusion, why would we expect a color-magnitude relation?

The gas that accretes onto the black hole is still hot and so must follow the Blackbody Radiation law.

If this is so obvious, why hasn’t it been done before?

Well it has but to no great success

So why are we trying again?

Possibly not a large enough sample, not enough wavelengths to avoid emission lines, and AGN are variable

We have new data covering a much wider wavelength range and with better sensitivity

VGSlide6

GALEX

VGSlide7

GALEX data

To study UV in general and to study it in AGN specifically, the Galaxy Evolution Explorer (GALEX) satellite was launched in 2003.

It operates in two bands at 1528 angstroms (FUV) and 2271 angstroms (NUV)

Better resolution and than any previous UV mission: 4.3” at FUV and 5.3” at NUV.

Better sensitivity than any previous UV mission

AGN are bright in the UV and because of that also towards the color blue in the optical. This is called the blue excess that was detected early in the history of AGN and is used as a sign that a galaxy has an AGN.

VGSlide8

GALEX Filters

VGSlide9

GALEX Field of View

VGSlide10

Difference between Optical and UV

in a galaxy

VGSlide11

GALEX sky coverage

Galactic Coordinates

VGSlide12

Sloan Digital Sky Survey

(SDSS)

VGSlide13

SDSS

The Sloan Digital Sky Survey or SDSS is a major multi-filter imaging and spectroscopic redshift survey using a dedicated 2.5-m wide-angle optical telescope at Apache Point Observatory in New Mexico

Data collection began in 2000, and the final imaging data release covers over 35% of the sky

The survey has photometric observations of around 500 million objects and spectra for more than 1 million objects

VGSlide14

SDSS Filters

VGSlide15

Sky Coverage

VGSlide16

SDSS spectra were used with

the Hubble law to create a map

VGSlide17

VGSlide18

VGSlide19

VGSlide20

Using templates like the ones below, SDSS has classified objects into different types of AGN

VGSlide21

VGSlide22

VGSlide23

VGSlide24

VGSlide25

VGSlide26

VG

End