/
OMI Science Team Meeting 			KNMI, De OMI Science Team Meeting 			KNMI, De

OMI Science Team Meeting KNMI, De - PowerPoint Presentation

alida-meadow
alida-meadow . @alida-meadow
Follow
397 views
Uploaded On 2016-11-23

OMI Science Team Meeting KNMI, De - PPT Presentation

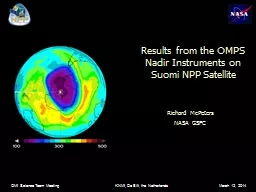
Bilt the Netherlands March 12 2014 Results from the OMPS Nadir Instruments on Suomi NPP Satellite Richard McPeters NASA GSFC OMPS Sensor Views NM OMPS Sensor Views NP OMPS Sensor Views ID: 492338

nadir omps profile ozone omps nadir ozone profile omi nasa product data profiler noaa high average hpa mapper sensor

Share:

Link:

Embed:

Download Presentation from below link

Download Presentation The PPT/PDF document "OMI Science Team Meeting KNMI, De" is the property of its rightful owner. Permission is granted to download and print the materials on this web site for personal, non-commercial use only, and to display it on your personal computer provided you do not modify the materials and that you retain all copyright notices contained in the materials. By downloading content from our website, you accept the terms of this agreement.


Presentation Transcript

Slide1

OMI Science Team Meeting KNMI, De Bilt, the Netherlands March 12, 2014

Results from the OMPS Nadir Instruments on

Suomi NPP Satellite

Richard McPetersNASA GSFCSlide2

OMPS Sensor Views

NMSlide3

OMPS Sensor Views

NPSlide4

OMPS Sensor Views

LPSlide5

Nadir Sensor Consists of a Mapper and a Co-Boresighted Profiler

Single pushbroom telescopeTwo grating spectrometersEach spectrometer has a 740x340 pixel CCD detector arrayBoth sample spectrum at 0.42 nm, 1 nm FWHM end-to-end resolution Calibration stability maintained by periodic solar observations using dual reflective diffusers

Telescope

Total Column Spectrometer

Profile

Spectrometer

Nadir total

column mapper: 300-380

nm

@1 nm resolution

Nadir

profiler:

250-310 nm

@1 nm resolutionSlide6

OMPS Nadir Mapper StatusLaunched on

Suomi-NPP 28 Oct 2012 Data available from February 2012 to March 2014NOAA’s operational NM product http://www.class.noaa.govNASA science team’s research productCompatible with OMIUses the NASA v8 algorithmQuality consistent with OMIhttp://ozoneaq.gsfc.nasa.gov/ompsOzone ST & PEATESlide7

NASA product from NM - 1.4% offset due to use of

Brion-Daumont-Malicet ozone cross sectionsSlide8

We propose to process NPP

mapper data with PK’s v9 algorithm very similar accuracy to v8 accuracy better at high solar zenith angles will include Joanna’s cloud height retrieval will give error for each FOVNM ozone map for February 21, 2013Slide9
Slide10

The OMPS NM and OMI benefit each other

OMIOMPS NMSlide11

OMI reveals issues with OMPS calibration

Why does OMPS – OMI Ozonedifference switch sign over highsouthern latitudes?Dobson Units-8-7

-6-5-4-3-2-1012

345678Dobson UnitsSlide12

OMPS reflectivity (over snow/ice) too high

OMPSOMIPercent

-8-7-6-5-3-2-10

1234567-480

82

8486

889092

94

96

98

100

Percent

80

82

84

86

88

9

0

92

94

96

98

100

PercentSlide13

OMPS NP Product

NOAA’s operational NP product

Based on NASA V6 algorithmhttp://www.class.noaa.govNASA science team’s NP research productBased on NASA V8.6 algorithmCompatible with SBUV/2 long-term recordFormats consistenthttp://ozoneaq.gsfc.nasa.gov/ompsPressure (hPa)Dobson UnitsComparison of average OMPS NPresearch product profile to average MLS profile for 23 June, 2012

(-20 < Latitude < 20 degrees)Sum of MLS profile = 235.7 DUSum of OMPS profile = 236.7 DUSlide14

Comparison of the average OMPS limb profile with the average nadir profile for September 2013.Slide15

High energy particles in the South Atlantic Anomaly (SAA) affect imaging sensors.

Map of South Atlantic Anomaly effects on OMPS NM closed-door dark current measurements in December and November 2011, overlaid with OMPS NP SAA Flags (0 to 8) for 3/5-6/2012252 nm radiance

The noise / dark current increases when an orbital path falls with within the SAA, mainly affecting short wavelengths in the Nadir Profiler. (252 nm plotted)Slide16

Ozone % difference – Nadir Profiler

vs NOAA 191.0 – 1.6 hPaSlide17

Ozone % difference – Nadir Profiler

vs NOAA 194.0 – 6.3 hPaSlide18

Performance of OMPS nadir NM & NP sensors is very good can be used to produce high quality ozone retrievals“Soft calibration” needed, particularly at NM far off-nadir scenes

NASA research product ~1.5% higher than OMIOMPS data (NP & NM) will be used to extend ozone long-term ozone data recordsalgorithm consistent with heritage dataset should be used to process data (v9 for TOMS, OMI, and NPP NM)SAA anomaly affect NP measurement10-20% error neear 1 hPa<2% below 5 hPaNo effect on total column ozoneConclusions