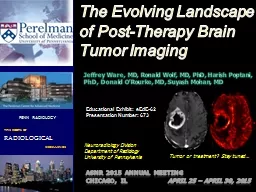
Jeffrey Ware MD Ronald Wolf MD PhD Harish Poptani PhD Donald ORourke MD Suyash Mohan MD Neuroradiology Division Department of Radiology University of Pennsylvania ASNR 2015 Annual Meeting ID: 705399
Download Presentation The PPT/PDF document "The Evolving Landscape of Post-Therapy B..." is the property of its rightful owner. Permission is granted to download and print the materials on this web site for personal, non-commercial use only, and to display it on your personal computer provided you do not modify the materials and that you retain all copyright notices contained in the materials. By downloading content from our website, you accept the terms of this agreement.
Slide1
The Evolving Landscape of Post-Therapy Brain Tumor Imaging
Jeffrey Ware, MD, Ronald Wolf, MD, PhD, Harish Poptani, PhD, Donald O’Rourke, MD, Suyash Mohan, MDNeuroradiology DivisionDepartment of Radiology University of Pennsylvania
ASNR 2015 Annual Meeting Chicago, IL April 25 – April 30, 2015
Tumor or treatment? Stay tuned…
Educational Exhibit: eEdE-62
Presentation Number: 673
Slide2
Disclosure Statement
Neither the authors nor their immediate family members have a financial relationship with a commercial organization that may have a direct or indirect interest in the contentSlide3
Background
Improvements to the standard treatment of brain gliomas are resulting in prolonged survival and better overall outcomesNew treatments are also bringing about new and complex imaging manifestationsThis exhibit reviews key concepts in neuro-oncologic imaging essential to accurate radiological assessment in the perioperative and postoperative setting
Preoperative planningPreoperative mappingRisk-benefit assessmentPost-therapy imagingPerioperative infarctPseudoprogressionTrue progression
Radiation necrosis
PseudoresponseTreatment
response criteriaEmerging therapies
Laser-induced thermal therapy
Vaccine
and
immunotherapies
Tumor-treating
fields
OutlineSlide4
Extent of Resection
Maps of language cortex (left) and white matter tracts (right) overlaid on anatomic images depict the anatomic relationship of tumor to nearby eloquent structures
1
Sanai
N, et al (2011) An extent of resection threshold for newly diagnosed glioblastomas
. J Neurosurg
115:3–82
McGirt
MJ, et al.
(2009) Association of surgically acquired motor and language deficits on overall survival after resection of
glioblastoma
ultiforme
.
Neurosurgery 65:463–469
Preoperative mapping of eloquent cortex and white matter tracts with
fMRI
and
diffusion
tractography
, respectively, allows more informed surgical planning
Mortality
benefits
of cytoreduction
1
can be more accurately weighed against
morbidity of
postoperative neurologic deficits
2Slide5
Cytoreduction
vs. Postoperative DeficitsPreoperative MRI in a 57 year-old man with GBM. Diffusion tractography (DTI) of the corticospinal tract (CST) superimposed on anatomic imagesFLAIR & DTIT1+C & DTIT1+C &
DTIClose
proximity of tumor to the right CSTSlide6
Early follow-up MRI shows
thick, nodular enhancement about the posterior and medial margin of the resection cavity, consistent with residual neoplasm which was unable to be resected due to proximity to the CST. The patient did not experience new neurologic deficits following surgery.T1+CFLAIRT1
Follow-up MRIEarly
recurrence/True Progression (TP)
Subsequent follow-up MRI
FLAIR
T1+CSlide7
Cytoreduction
vs. Postoperative DeficitsPreoperative MRI in a 44 year-old man with GBM. DTI of the CST and fMRI of hand motor areas superimposed on anatomic images show proximity of tumor to eloquent structuresT1+CFLAIR & fMRI
FLAIR & DTIPostoperative MRI shows complete resection of enhancing tumor, however the patient developed new right-sided weakness and aphasia
T1+C
Postoperative
tractography
was performed, demonstrating the left CST
remained intact
The patient experienced near-complete functional recovery, as the symptoms were due to a supplementary motor area syndromeSlide8
Preoperative Mapping: Benefits
Eloquent cortical mapping (fMRI)1Tractography for operative planning & intraoperative navigation (DTI)2,3
1Petrella JR., et al., “Preoperative fMRI Localization of Language and Motor Areas: Effect on Therapeutic Decision Making...” Radiology (2006)2Wu JS, et al. “Clinical Evaluation and Follow‐Up Outcome of DTI‐Based Functional Neuronavigation,” Neurosurgery (2007)
Smaller craniotomy
Reduced duration of surgery
Selection of more aggressive surgical strategy
Greater extent of resection
Reduced duration of surgery
Decreased seizure incidence
Improved postoperative motor performance
Higher median survival in high grade gliomasSlide9
Post-Therapy Imaging
Early postoperative MRI – within 24H (maximum 72H) of surgeryAssess extent of resection & residual tumorIdentify perioperative ischemia – include DWIIndications for follow-up imagingAssess prognosis of postoperative neurologic deficitsBefore chemotherapy and/or radiationChange in clinical statusRoutine surveillance
Techniques
Conventional MRI
Diffusion MRIMR
perfusion and permeabilityMR spectroscopy
Positron emission tomography (PET)
Post-therapy imaging overview at the University of PennsylvaniaSlide10
Preoperative images show enhancing & non-enhancing components of a recurrent glioma, which underwent re-resection
PreoperativePostoperativeFollow upT1+CT1+CT1+C
T1DWIDWIFLAIR
Perioperative Ischemia
Recognition
of perioperative infarct is important to avoid misclassification of
enhancement in an evolving infarct
as recurrent
neoplasm on follow-up imaging
Immediate postoperative images
reveal new
restricted diffusion adjacent to the resection cavity, indicating
a perioperative
infarct
On follow-up,
gyriform
enhancement about the resection cavity represents an evolving
subacute
infarct rather than recurrent
tumorSlide11
Temozolomide
(TMZ) and MGMTTMZ induces tumor cell death by causing DNA damageMGMT (O-6-methylguanine-DNA methyltransferase) is involved in DNA repairTumor cells expressing a silencing MGMT promoter methylation exhibit inhibited DNA repair and are more sensitive to TMZMGMT promoter methylation is associated with improved survival with TMZ treatment
Pseudoprogression (PsP) – refers to clinical & radiologic manifestations of an
exaggerated but favorable treatment response
On MRI, manifests as progressive edema and enhancement,
thereby mimicking true tumor progressionOccurs
in the early post-treatment period (<6 months)
Mechanisms
Pseudoprogression
(
PsP
)Slide12
Pseudoprogression
Follow-up MRI in a patient status post recent chemoradiation for glioblastoma shows new focal enhancement adjacent to the resection cavityT1+CFLAIRPre-radiationFollow up
Distinguishing PsP from true progression is critical to avoid discontinuing effective therapy, as
PsP
represents a favorable treatment response
?
Does this represent true tumor progression or
pseudoprogression
?Slide13
PsP
vs. True ProgressionConventional MRIClinical evaluation and conventional MRI have significant limitations in distinguishing treatment effects from early tumor progression (EP)
Most conventional MRI features are not specific to either PsP or EP11Young RJ, et al. Potential utility of conventional MRI signs in diagnosing pseudoprogression in glioblastoma.
Neurology
. 2011; 31;76(22):1918-24.
T1+C images obtained immediately following tumor resection (left), and at 4 and 8 months following resection (middle and right, respectively) show
progressive nodular enhancement about the resection cavity with
subependymal
extension
Progressive
subependymal
enhancement
, however, is
relatively specific
for
true tumor
progression
The
findings proved
to
represent
tumor progression
at
re-resection
.Slide14
PsP
vs. True ProgressionMR PerfusionTPPsP
TUMOR
High blood volume (
rCBV
)
due to high vascular density
High vascular permeability (
K
trans
)
due to immature
neovasculature
PsP
Lower blood volume (
rCBV
)
due to relative absence of
neoangiogenesis
MR perfusion measurements of blood volume differ significantly between
PsP
and TP (right). There is some overlap, however, due to pitfalls and the fact that treatment effects may coexist with residual/recurrent tumor.
Pitfalls
Low
rCBV
in tumor may result from necrosis &
edema resulting in vessel compression and subsequent
hypoperfusion
High
rCBV
in
PsP
may result from aneurysm, telangiectasia, vascular elongation, or endothelial
proliferationSlide15
PsP
vs. True ProgressionMR Perfusion
rCBV
K
trans
v
p
T1+C
PsP
TP
ADC
MR perfusion measurements can aid in distinguishing
pseudoprogression
from true tumor progression. Note areas of
relatively higher cerebral blood volume (3
rd
column) and permeability (5
th
column)
in the case of true progression.Slide16
PsP
vs. True ProgressionPost-opFLAIRT1+CrCBV3 month Follow up
Progressive edema and enhancement about the resection cavity is concerning for recurrent glioma
rCBV
remains low, however, suggesting
pseudoprogression
Slide17
p53
Ki-67H&E (10X): Reactive brain tissue, hyalinized vessels
H&E (20X): Reactive brain tissue, hyalinized vesselsFinal Pathology Diagnosis: Predominantly
treatment effect with small proportion (<10%) of residual
gliomaSlide18
MR Spectroscopy
Normal Brain Glioma
Glial tumors demonstrate a higher choline peak and a lower N-acetylaspartate (NAA) peak
compared to normal brain
MR
spectroscopy (MRS) allows characterization and quantification
of certain metabolites within a region of
interest
Cho
NAA
NAA
Cho
Courtesy:
Gaurav
VermaSlide19
MR Spectroscopy – EPSI
3D mapping of choline-to-creatinine ratio in a patient with a glioma
Multislice
echo-planar spectroscopic imaging sequences (EPSI) utilize very short echo times to construct a high-resolution metabolite map of the entire
brain from
a single
15 minute examination
Courtesy:
Gaurav
VermaSlide20
MR Spectroscopy – EPSI
Metabolite Maps
Cho/CrCrCho/NAA
NAA
Cho
Courtesy: Gaurav VermaSlide21
MR Spectroscopy – EPSI
T1+C
FLAIR
Segmentation
Enhancing
Immediate
Peritumoral
Distant
Peritumoral
Overlaying MRS data on anatomic segmentations allows metabolite profiles of different regions (tumor,
peritumoral
, and distant
peritumoral
) to be assessed and compared
Courtesy:
Gaurav
Verma
EPSISlide22
PsP
vs. True ProgressionMR SpectroscopyTrue Progression Pseudoprogression
Distant
Peritumoral
Immediate
Peritumoral
Enhancing
Cases of true progression show higher choline across all three regions, and particularly in the enhancing region
Courtesy:
Gaurav
VermaSlide23
PsP
vs. True ProgressionIntegration of Multiparametric ImagingPost-op4 month follow-upFLAIR
T1+CrCBVKtrans
Vp
Follow up MRI reveals
progressive enhancement adjacent to the
glioma
resection cavity
Perfusion parameters
rCBV
,
Ktrans
, and
Vp
are
elevated
. Spectroscopy
demonstrates an
elevated Cho/NAA
.
Integrated findings are highly concerning for
true progression
.
NAA
ChoSlide24
H&E (2.5x): Residual/recurrent
gliomaH&E (20x): Residual/recurrent gliomap53Ki-67Final Pathology Diagnosis:
Predominantly (75%) recurrent/residual gliomaSlide25
PsP
vs. True ProgressionDifferentiation – Summary Specific clinical & imaging features do, however, greatly influence the likelihood that imaging findings in the post-treatment setting represent either PsP or tumor progressionPredictorPseudoprogressionTrue progression
Clinical symptomsNo new symptomsNew neurologic symptomsMGMT promoter statusMethylatedUn-methylatedLesion number
Single
MultipleEnhancement pattern
Rim-enhancement, central necrosisSolid, nodular,
subependymalMR perfusion
Low,
stable, or decreasing
rCBV
High or increasing
rCBV
MR diffusionHigh
ADC (necrosis)
Low ADC (cellularity)
MR spectroscopy
Depressed
Cho, Cr, NAA peaks
High lipid/lactate
High
Cho/Cr
High Cho/NAA
PET
Low metabolic activity
High metabolic
activity
Pseudoprogression
remains a clinical diagnosis which requires
integration of clinical data and radiologic
findings; thereby necessitating a team-based approach including radiologists,
neurosurgeons, and neuro-oncologists
No single
predictor has
sufficiently high sensitivity and specificity to reliably
differentiate
PsP
from true progression on a routine
basisSlide26
Radiation Necrosis (RN)
White matter hypoperfusion and necrosis resulting from radiation-induced vasculopathyIn contradistinction, PsP represents treatment effect on tumor and blood-brain barrier and should replace the outdated term early radionecrosis
Progressive edema and enhancement, thereby mimicking true tumor progression
Occurs months to years following
therapy
Classic “soap bubble” or “swiss cheese” MRI appearance, however
no imaging features are widely accepted as specific for RN, which remains a pathologic
diagnosis
Mechanisms
Imaging FeaturesSlide27
Radiation Necrosis (RN)
FLAIRT1+CrCBV
NAACrChoLipid/lactate
Follow up MRI (bottom row) reveals
progressive enhancement and edema
about the resection cavity The corresponding region, however, demonstrates
relatively low rCBV. MR
spectroscopy reveals
a
high lactate peak, low Cho/NAA, and a relative decrease in all normal metabolites
.
Integrated findings
suggest radiation necrosis rather than progressive neoplasm.
Advanced
MR techniques
hold
the potential to better characterize RN
, but
this remains an area of active
researchSlide28
Antiangiogenic Therapy
Glial tumors rely on dysregulated angiogenesis, leading to the formation of abnormal, permeable blood vesselsAntiangiogenic therapy refers to antibody-mediated inhibition of vascular endothelial growth factors (VEGF)Inhibition of VEGF results in vascular normalization (↓ vessel diameter, ↓ permeability, and basement membrane thinning)
Antiangiogenic therapy results in rapid reduction of enhancement and edema
Little survival
benefit without concomitant cytotoxic
therapyMay promote the
development of an invasive, non-enhancing phenotype
Pseudoresponse
(
PsR
) – progression of non-enhancing tumor despite ↓ enhancement
and
vessel permeability
Mechanisms
Imaging ManifestationsSlide29
Pseudoresponse
Pre-AvastinPost-Avastin 1
Post-Avastin 2T1+CFLAIR
rCBV
Pre-therapy scan shows an enhancing mass in the right temporal
lobeFollowing initiation of antiangiogenic therapy, there is
marked decrease in enhancement and adjacent edema
Subsequent MRI shows
increasing T2 signal and
rCBV
adjacent to the lesion
despite
minimal enhancement,
suspicious
for progression of the non-enhancing tumor componentSlide30
Treatment Response Criteria
1Macdonald DR, et al. Response criteria for phase II studies of supratentorial malignant glioma. Journal of Clinical Oncology 8, 1277–1280 (1990)2Wen PY, et al. Updated Response Assessment Criteria for High-Grade Gliomas: Response Assessment in Neuro-Oncology Working Group. Journal of Clinical Oncology 28, 1963–1972 (2010)McDonald Criteria
1Most widely used guidelineRelies on the product of largest diameters of enhancing tumor
Key Limitations
Enhancement is not
specific to
tumor
Doesn’t
account for non-enhancing
tumor
Doesn’t
account for
multifocality
Doesn’t
address
PsP
or
PsR
RANO Criteria
2
(
R
esponse
A
ssessment in
N
euro-
O
ncology)
Both clinical and imaging components
Enhancing and non-enhancing tumor
Measurable and non-measurable disease
Accounts for
PsP
and
PsR
First progression following therapy (<12 weeks)
New enhancement outside radiation field
Pathologic confirmation of progression
First progression following therapy (>12 weeks)
New
lesion outside treatment
field
Increase
in size of ≥ 25% (accounting for
steroids)
Increase
in non-enhancing tumor
on
anti-angiogenic
RX
Clinical
deterioration not otherwise explained
RANO Criteria should be considered when evaluating glioma treatment responseSlide31
Emerging Therapies
Laser-Induced Thermal TherapyVaccine & Immune-Based Therapy
Tumor-Treating FieldsSlide32
Laser-Induced Thermal Therapy
30 year old woman with a non-enhancing right frontal mass lesion,
rCBV is not elevated
FLAIR
T1+C
FLAIR/
rCBV
Norred
SE, & Johnson JA. Magnetic Resonance-Guided Laser Induced Thermal Therapy for Glioblastoma
Multiforme
: A Review.
BioMed
Research International
2014,
1–9 (2014
)
Laser
ablation was elected over
craniotomy and was
performed at the time of stereotactic
biopsy, which confirmed the diagnosis of WHO grade II
glioma
. MRI images confirm fiber placement within the lesion and are subsequently used to monitor tissue heating
Optical fiber introduced into tumor is used to deliver direct laser energy, inducing thermal damage & necrosis
Less invasive
treatment approach
Performed concurrently with MRI
Confirm correct fiber location
Real-time monitoring of tissue heatingSlide33
Vaccine & Immune Therapies
Ongoing clinical trials for recurrent GBM:Vaccines against tumor-specific antigens (rindopepimut, HSPPC-96)Stimulated autologous dendritic cells pulsed with immunogenic tumor antigens (ICT-107)Redirected autologous T-cells engineered to target tumor-specific moieties (CART-EGFRvIII)Experimental treatments are resulting in new and complex imaging manifestations in the post-treatment setting
Surveillance examinations in a patient with recurrent GBM on a vaccine therapy show nodular enhancement and elevated
rCBV
, suggesting tumor progression
T1+C
rCBV
6 months
12 months
Biopsy, however, revealed a predominance of necrosis
80% necrosis
6
0-70% necrosisSlide34
Tumor-Treating Fields
Novel therapeutic methodologyDirect application of a non-uniform electric field Disrupts mitotic activity within actively dividing cellsPreferentially induces apoptosis within tumor cellsCourtesy: NovaCare
1Wong ET et al. Response assessment of NovoTTF-100A versus best physician’s choice chemotherapy in recurrent glioblastoma. Cancer Medicine. 2014 Jun;3(3):592–602.In
a phase III clinical trial for recurrent GBM
1, demonstrated equivalent efficacy and less toxicity when
compared to chemotherapySlide35
Conclusions
RANO criteria should be considered to evaluate treatment responsePseudoprogression: CommonSuspect with of enhancing lesion ~ 3 monthsMore often seen with methylated MGMTImproved overall survivalMR perfusion and spectroscopy can help differentiate from true progression
Pseudoresponse:
Rapid decrease in
contrast enhancement with a high response rate
Progression of non-enhancing tumor componentModest effects on overall survival
Emerging brain tumor therapies are resulting in new and complex imaging patterns in the post-treatment setting
Advanced
multi-parametric
imaging techniques
hold promise
for improved characterization of
post-treatment patterns
, however this remains an active area of research
&
will likely require more prospective testing &
standardized
quantitationSlide36
Acknowledgements
Gaurav VermaSumei WangSulaiman SheriffAndrew MaudsleyR21 Grant: 1R21CA170284EPSI Development GroupSlide37
PENN RADIOLOGY
THE ROOTS OF RADIOLOGICAL EXCELLENCETHANKS FOR VIEWING OUR EXHIBIT!jeffrey.ware2@uphs.upenn.edusuyash.mohan@uphs.upenn.edu