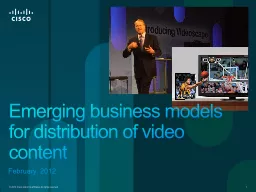
Market Dynamics CEOver The Top Brand power Building application amp content ecosystems New Streaming subscription services Service Provider Multiscreen offering becoming table stakes ID: 802010
Download The PPT/PDF document "February, 2012 Emerging business models ..." is the property of its rightful owner. Permission is granted to download and print the materials on this web site for personal, non-commercial use only, and to display it on your personal computer provided you do not modify the materials and that you retain all copyright notices contained in the materials. By downloading content from our website, you accept the terms of this agreement.
Slide1
February, 2012
Emerging business models for distribution of video content
Slide2Market Dynamics
CE/Over
The Top
Brand power
Building application & content
eco-systems
New Streaming
subscription services
Service Provider
Multi-screen offering becoming table stakes
Partnerships &
Vertical Integration
Rising churn and Subscriber acquisition cost
Broadcasters and Media
New distribution
platform & interactive content –
Sky Sport TV on
iPad
/
RTL
on
iPhone
&
iPad
Hybrid Broadcast Broadband TV
:
HbbTV
New business models –
Hulu
2009 revenue: $100M
1
st
half
2010
revenue: $100M
Consumer Behavior
Netflix = 20% of US downstream internet traffic in peak times
Online Video Snacking
11.4 Hour /month
Video = 91% of consumer
IP traffic by 2014
20%
Slide33
Consumer Experience
Content Fragmentation
Broadcast, Premium,
UGC
Device &
Screen Fragmentation
TV, PC, Mobile, Gaming,
PDA
Interactivity Fragmentation
Lean back, Lean forward, Social
Business Models
Subscription Fragmentation
Broadband, TV, Mobile, Movie rentals, OTT
Free vs. Paid
Ad Dollars Fragmentation
Transition from linear TV to online
© 2012 Cisco Systems, Inc. All rights reserved.
A Fragmented Video Market
Slide4Age 2+
Age 12-17
Age 18-34
Age 35-54
Age 55-64
Age 65+
30.2%
39.5%
32.7%
30.8%
33.8%
24.8%
Source : Nielsen Convergence Summit
Simultaneous TV and Internet Use
Slide520
Mostly Missed Episodes Online
What Kind
of TV Programs do you Stream or Download
and Watch
on a PC?
Total
18-34 Age 35-54 Age
55+ Age
Missed episodes
of shows I watch on TV
Episodes of TV shows I do
NOT watch on TV
Episodes of TV shows I have
ALREADY watched on TV
Episodes of
past shows that are
not on TV now
None of these
Source : CBS Entertainment Panel Survey, July 2009
88%
27%
16%
39%
4%
89%
36%
21%
44%
2%
88%
26%
16%
40%
4%
86%
20%
11%
31%
7%
Reasons for Watching Computer Video
When
at
Home
Base: Watch Video on the Computer at Home
Consumers Watch Video on Their Computers
To Time-Shift
and Multi
-Task
75% of respondents watch video on
computers
Each week, they watch about 1 hour, 45 minutes of video on computer
They watch at home 63% of time
93% of 18- to 24-year-olds watch video on a computer, averaging 2 hours, 45 minutes per session
40
% of respondents watch video using portable devices
Each week, they watch about 54 minutes of video on portable devices
39% of this time, they are at home
Source: Cisco IBSG Connected Life Market Watch,
2012
Consumers Choose Alternative Devices, Even When TV Is Available
Device
Shifting
Slide7Experiences Consumers Want Now
But SP’s Struggle to Deliver
Multi-screen TV experience
Online Content on TV /STB
Intuitive Unified Navigation for All Content
Web 2.0 Experiences on TV/STB
Slide8Interesting facts: target devices
About half of the Netflix users watch it on a console (XBOX 360, Wii or
Playstation 3)89% of the HULU users watch it directly from their PCs (compared to 42% of the Netflix users)
About 20% of the Netflix users watch it on
SmartTV
37%
of the iPhone users watch video on their phone (6x as likely as the typical subscriber)Vital question: is your content and distribution network ready to be delivered to all these devices – consoles, PC, mobile devices, SmartTVs?
Source: GamePolitics.com, Market Watch, Nielsen.com
Slide9Living the
Videoscape
Experience
More Visual
More Social
John
Slide10Living the
Videoscape
Experience
More Visual
More Mobile
Slide11Pressure on the technology everywhere
O
n the content quality and quantity – more and better
Network
Cloud
Client
O
n the delivery network: delivery on managed and unmanaged networks
On the consumer device: delivery to any device
1
2
3
The weakest (technology) point will ruin the experience
Σ
Slide12ARPU
per Bit (Revenue)
Data Traffic (Cost)
Coming
Profitability
Gap
Increase Revenue
Multiple options for monetizing
services enabled by
Videoscape
Enable partnerships
Ad
revenue
Partnered content
Cloud
Client
Network
Reduce Costs
Manage “over the top” video traffic
CapEx
:
Make better use of
resources
OpEx
:
Manage video bandwidth during peak usage
Improve Experience
Three-screen experience and session
shifting
Quality of video experience
The Threefold Challenge
Slide13Primary TVE Business Models
Model 1 – Subscription / Transaction
Monthly fee or per transaction purchases (Download to own, Rental)
Could also be a combination of both.
More appropriate for data SP’s who want to expand service offering into video space. (Good first step
)
Model 2
– Bundle Uplift / Reduce Churn
TV Everywhere offered to higher end service tiers at no additional
fee
Revenue is indirect through encouraging greater stickiness in higher service tiers.
Further revenue lifts via pull through business. “You’d like video – you might want to move up to the higher data service
tier”
Model 3 – Advertising Based
This is typically an OTT solution, which don’t have to be affiliated with Consumer SP’s
Revenue
is via advertising, typically as “price per mili
”, “price per click”, and inserted ads in programming
Slide14$
Time
Securing Growth Opportunities Require
SPs
to
Transition from Existing One-Sided Market Model
Limited Revenue Growth and Increasing Costs
Network
Termination
B2C
Business to Consumer
Peering
Points
$
Service
Providers
$
Rising Costs:
Increased SAC and Churn
Increased bandwidth usage
Bigger bundle of products
Flattening Revenues:
• Saturated markets – few new subscribers
• Increased use of flat-rate tariffs
• Regulatory & Competitive price pressure
Today
Broadcasters
Slide15Capitalizing on the Two-Sided Market
Differentiated User Experience, Service Velocity and Monetization
B2B2C
Business to Business to Consumer
$ $
$ $ $
Service
Providers
$ $ $$$
$ $ $
SP Platform
Leverage Network and Data Assets
Tomorrow
Broadcasters
Government
Advertisers
OTT/Content Aggregator
Application Developer
Utilities
Slide16Interesting facts: NFL and NBC Sports streamed Super Bowl in Feb.
Streaming was limited to the customers of Verizon only, for PC and mobile platforms, based on SilverlightTime lag was between 15 sec and 45 sec.
2.1m users watched the game online (from total 111.3m), average 39 min/view.
Source:
Streamingmedia.com
,
nfl.com
Vital question
: is your distribution network ready to take a load of 2% of your viewers, going on-line? Would you compromise the quality of your top content because of lack of preparation?
Slide17