/
INQUINAMENTO AMBIENTALE E MALATTIE RESPIRATORIE INQUINAMENTO AMBIENTALE E MALATTIE RESPIRATORIE

INQUINAMENTO AMBIENTALE E MALATTIE RESPIRATORIE - PowerPoint Presentation

alyssa
alyssa . @alyssa
Follow
30 views
Uploaded On 2024-02-09

INQUINAMENTO AMBIENTALE E MALATTIE RESPIRATORIE - PPT Presentation

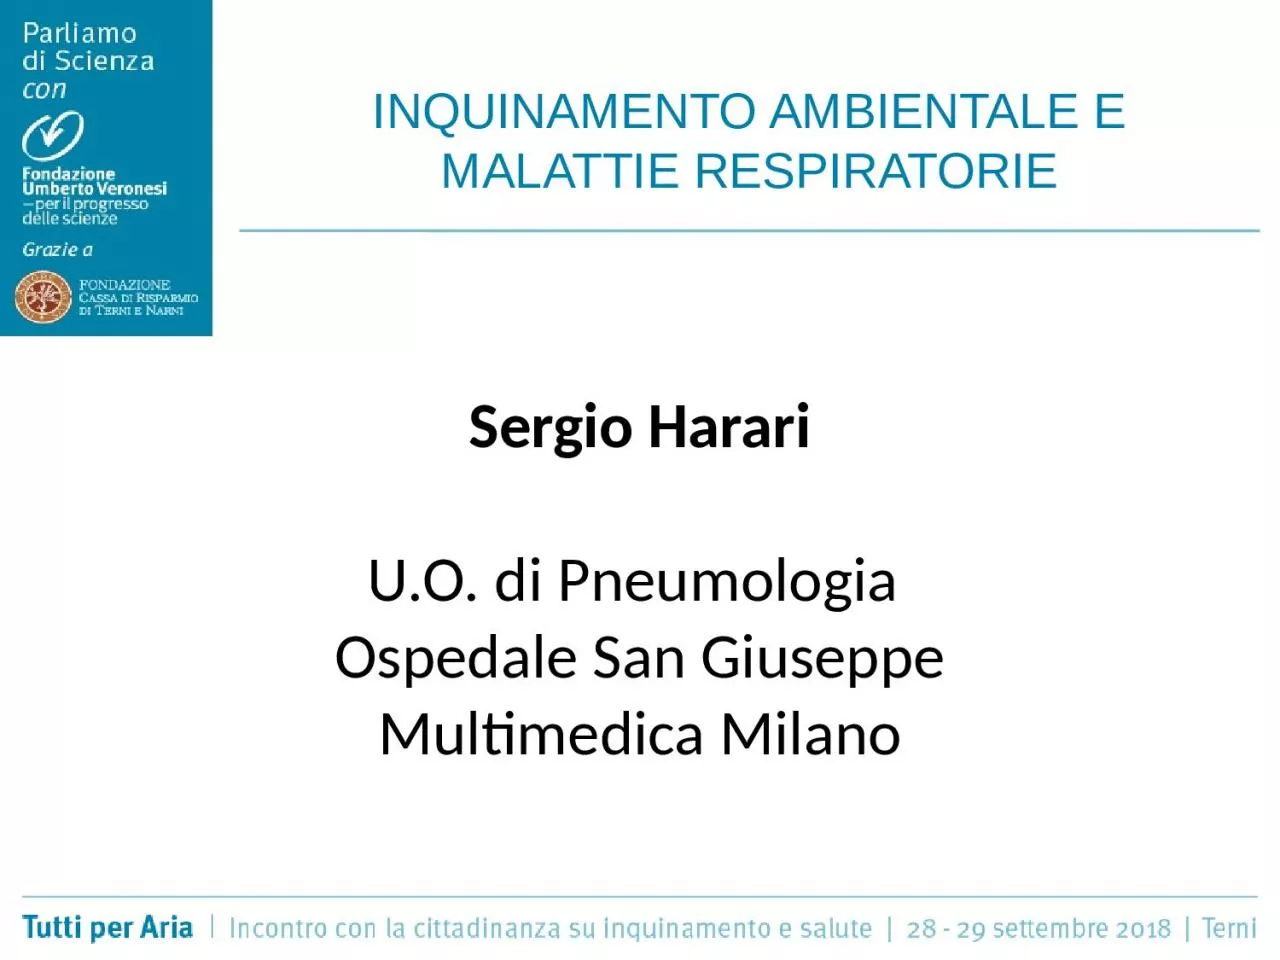
Sergio Harari UO di Pneumologia Ospedale San Giuseppe Multimedica Milano 1 High blood pressure 2 Smoking 3 Alcohol use 4 Household air pollution 5 Low fruit consumption Global risk factor ranking ID: 1045100

pollution air effects ipf air pollution ipf effects 2005 case exposure disease no2 pm10 traffic incidence lung respiratory concentration

Share:

Link:

Embed:

Download Presentation from below link

Download Presentation The PPT/PDF document "INQUINAMENTO AMBIENTALE E MALATTIE RESPI..." is the property of its rightful owner. Permission is granted to download and print the materials on this web site for personal, non-commercial use only, and to display it on your personal computer provided you do not modify the materials and that you retain all copyright notices contained in the materials. By downloading content from our website, you accept the terms of this agreement.


Presentation Transcript

1. INQUINAMENTO AMBIENTALE E MALATTIE RESPIRATORIESergio HarariU.O. di Pneumologia Ospedale San GiuseppeMultimedica Milano

2. 1. High blood pressure2. Smoking3. Alcohol use4. Household air pollution 5. Low fruit consumptionGlobal risk factor rankingThe Global Burden of Disease Study 2010Lancet 2013, January 4 6. High BMI 7. High plasma glucose 8. Childhood underweight 9. Ambient air pollution 10. Physical inactivityAir pollution is a major risk factor for public health

3. Emerging air pollution London 1952New Delhi 2015Annesi-Maesano, ERJ 20153

4. The Lombardy region, in the center of Po Valley – Northern Italy, has nearly 10 million inhabitants. It is the most populated Italian regionMilanPoValley One of the most polluted areas in Europe because of industrial plants, intensive agriculture and high population density. The presence of the Alps and Apennines acts as a barrier favoring stagnation conditions and accumulation of pollutants

5. The Po River basin is bordered on three sides by mountains. Weather disturbances are frequently unable to cross the Alpine barrier. Poor air mass exchange causes frequent phenomenon of thermal inversion, with smog and pollution being trapped close to the ground.

6. BrainVascular systemRegenerative organsMetabolismRespiratory Disease MortalityRespiratory Disease MorbidityLung CancerPneumoniaUpper and lower respiratory symptomsAirway inflammationDecreased lung functionDecreased lung growthLungInsulin ResistanceType 2 diabetesType 1 diabetesBone metabolismHigh blood pressureEndothelial dysfunctionIncreased blood coagulationSystemic inflammationDeep Venous ThrombosisStrokeNeurological developmentMental HealthNeurodegenerative diseasesCardiovascular Disease MortalityCardiovascular Disease MorbidityMyocardial InfarctionArrhythmiaCongestive Heart FailureChanges in Heart Rate VariabilityST-Segment DepressionHeartPremature BirthDecreased Birth WeightDecreased foetal growthIn uterine growth retardationDecreased sperm qualityPreclampsiaJoint ERS / ATS statement (ERJ 2017)Air pollution affects multiple organs immediately and has long-term consequences

7. 3 billiardsThe direct costs of air pollution for respiratory diseases7

8. Premature mortalityHospital admissionsEmergency room visitsVisits to doctorRestricted activity/reduced performanceMedication useSymptomsImpaired pulmonary functionSub clinical (subtle) effectsSeverity of health effectProportion of population affected Source: American Thoracic Society, 2000Air pollution respiratory effects pyramid

9.

10. SUSCEPTIBILITIES matterPolicies, prevention, advice & treatment need to protect ALL PEOPLE- also the most susceptible ones … !Some factors considered in some studies:genetic…. sex/gender, ageunderlying diseases & phenotypes, smoking, diet & breast feeding, physical activity, BMI / obesitymedication, stressproximity to air pollution (environmental disparities)although lots of open questions to be tackled…10

11. 9227 SEPTEMBER 2016 | GENEVA - A new WHO air quality model confirms that 92% of the world’s population lives in places where air quality levels exceed WHO limits*. Information is presented via interactive maps, highlighting areas within countries that exceed WHO limitsNew interactive maps highlight areas within countries that exceed WHO air quality limits.11

12. State of evidence for respiratory health effects of «home outdoor» and «indoor» air pollutionAcute effects in asthmatics and others (also in children)Chronic bronchitis symptoms exacerbated by air pollution Childhood asthma caused by near-road traffic related air pollution (possibly adult-onset asthma too?)Possible etiologic role in asthma and COPDPossible etiological role in lung cancerPossible etiological role in IPFImportant cause of lower respiratory tract infectionsMajor cause of COPD in women (in low-income countries)Acute effects in asthmaticsOutdoorIndoor (biomass fuel)12

13. Asthma13

14. Mc Creanor J,NEJM Dec 2007Respiratory Effects of Exposure to Diesel Traffic in Person with Asthma14ST effects

15. Hyde parkOxford streetWalking for 2 hours on Oxford Street induced asymptomatic but consistent reductions in the forced expiratory volume in 1 second (FEV1) (up to 6.1%) and forced vital capacity (FVC) (up to 5.4%) . Mc Creanor J,NEJM Dec 200715

16. These changes were accompanied by increases in biomarkers of neutrophilic inflammationMc Creanor J,NEJM Dec 200716

17. 14% of asthma attributable to TRAP17

18. COPD03/10/2018Respirami Milano 2017 _ IAM18

19. 19Acute exacerbations

20. Per 10 mg/m3 increment in PM2.520Acute mortality and exacerbations

21. 21LT effects

22. FIGURE 2 Meta-analysis results summarising the centre-specific adjusted random-effect logistic regression model estimates of the effect of traffic variables on incidence of chronic obstructive pulmonary disease (COPD) (Global Initiative for Chronic Obstructive Lung Disease criteria all stages), in never-smokers, for increments in traffic intensity on the nearest road of 5000 vehicle?day-1 and in traffic load on major roads within a 100 m buffer of 500 000 vehicle?day-1?m in two categories. I-squared is the variation in estimate effect attributable to heterogeneity, and D+L the pooled random effects estimate of all studies. The logistic regression models were adjusted for sex at baseline, smoking at follow-up, maximal educational level, age at follow-up, age at follow-up squared, height at baseline, body mass index (BMI) at follow-up and BMI squared. ES: estimate.03/10/201822Respirami Milano 2017 _ IAMLT effects

23. An accumulation of damage to airways resulting from these acute effects is a plausible basis for any link between air pollution and the development of COPD23

24. While cigarette smoking is the leading preventable cause of COPD in the developed world, indoor solid fuel smoke exposure may be the leading preventable cause in lesser developed countries, particularly among women.24

25. COPD and solid fuel exposure25

26. 26

27. 20% of respiratory death attributable to air pollution27

28. 28

29. LDCs, Least Developed Countries.Percent of deaths attributable to solid fuelhttp://www.who.int/indoorair/publications/energyaccesssituation/en/index.htmlGraphic by data published by WHO 2009 29

30. IPF03/10/2018Respirami Milano 2017 _ IAM30

31. Source: Airbase/EEAOver the last decade, PM10 levels have remained overall stable and well above WHO guidelines...PM10 levels in the European Region of WHOWHO guidelines =20 µg/m3

32. Temporal trend of PM10 different emission sources in the entire Lombardy region (%)INEMAR

33. What’s the role of chronic air pollution exposure in the development of IPF?

34. The association between air pollution and the incidence of idiopathic pulmonary fibrosis in Northern ItalyS. Conti, S. Harari, A. Caminati, A. Zanobetti, Schwartz JD, Bertazzi PA, Cesana GC, F. Madotto, Eur Respir J 2018; doi.org/10.1183/13993003.00397-2017

35. To investigate the long-term relationship between exposure to three criteria pollutants – PM10, NO2 and O3 – and the incidence of IPF in Lombardy from 2005 to 2010Cross-sectional studyAim of the study

36. Case DefinitionInclusion criteriaIncident casesGeneric case definitionAt least one hospitalization or outpatient visit with diagnosis of IPF (ICD-9 CM code 516.3), between January 1st 2005 and December 31st 2010At least 5 years of follow-up before the first traceable diagnosis of IPF.2951Broad case definitionNo medical claims with a diagnosis of any other interstitial lung disease on or after the last medical claim with a diagnosis of IPF.2093Narrow case definitionAt least one hospitalization or outpatient visit with a procedure code for surgical lung biopsy or for computed tomography of the thorax on or before the last medical claim with a diagnosis of IPF..1309

37. GCD*N=2951BCD†N=2093NCD‡N=1309Incident cases of IPF from 2005 to 2010Males - N(%)1674 (56.7%)1252 (59.8%)772 (59.0%)Age at IPF onsetMean (SD)69 (13.0)70 (13.0)69 (12.9)Median (IQR§)72 (63; 79)72 (64; 79)72 (63; 79)Min; Max6; 986; 986; 95N° cases per municipality**** ††Mean (SD)1.9 (15.7)1.4 (11.3)0.8 (7.0)Median (IQR§)1 (0; 2)0 (0; 1)0 (0; 1)Min; Max0; 6020; 4330; 265CVII8.238.378.23* Generic Case Definition† Broad Case Definition* Generic Case Definition† Broad Case Definition** p-value of Wilcoxon test vs GCD <0.05†† p-value of Wilcoxon test vs BCD <0.05Incident cases of IPF (2005-2010)

38. The 2005-2009 average PM10 daily overall, warm (April – September) and cold (October – March) season concentrations were computed for each municipality, based on Aerosol Optical Depth measures We requested hourly NO2 and O3 concentrations measured from 2005 to 2010 at background and traffic monitoring stations (ARPA)Methods

39. Results – Map of the daily average PM10 concentration (2005-2009) at an aggregated area levelFigura 1. Mappa della concentrazione media giornaliera di PM10 dal 2005 al 2009.

40. Results – Map of the estimated daily average NO2 concentration (2005-2010) at an aggregated area level

41. Results – Map of the estimated daily average 8-hour maximum O3 concentration (2005-2010) at an aggregated area level

42. Age and gender adjusted incidence rates. Comparison between areas with an average NO2 concentration above and below 40 µg/m3.Age and gender adjusted incidence rates. Comparison between areas with an average NO2 concentration above and below 40 µg/m3

43. No association was detected between IPF incidence and PM10 and O3 chronic exposure Although often marginally significant, a positive association was observed between IPF incidence and NO2 concentration We observed that for each 1 µg/m3 increment in the chronic NO2 concentration, the incidence rate of IPF increased between 0.49% (95% CI: -0.15; 1.13) and 0.66% (95% CI: 0.17;1.15) depending on the IPF case definition used, the monitor selection strategy for exposure assessment and the season consideredConclusions

44. This is the first study showing that traffic-related pollution, traced by NO2, might have a role in the development of IPF. The precision of the estimates can be improved using subject-specific rather than aggregated data.The use of administrative databases allowed us to study a large and unselected population and consequently a large sample of cases, an essential condition to grant sufficient power in studies of environmental epidemiology.Conclusions

45. Air pollution induces oxidative stress, telomere shortening and cellular senescence, dysregulated fibrogenesis and inflammation. The development of diseases with “telomere dysfunction” like IPF needs the contribution of both genetic and environmental factors in order to develop the entire disease phenotypeWhat’s the rationale?

46. NO2 exposure has been associated with increased risk of respiratory hospitalization in COPD and asthma, and traffic-related air pollution exposure increases the risk of post lung transplant bronchiolitis obliterans syndrome

47. InflammationOxidative stressTGF-1Pro-fibrotic activityAberrant wound healingTelomere shortening

48. Potential factors of susceptibility and vulnerabilityOlder ageYounger ageGenderBMIPre-existing CVDsPre-existing AsthmaPre-existing DiabetesLower socio-economic statusSmoking habitsUnbalanced dietGeneticsAre IPF patients fragile and vulnerable people?

49. Air Pollution Epigenetic DiseaseBaccarelli & Kaufman, AJRCCM 2011inhibitor of gene expression49

50. What to tell patients?Stop running outdoors?Ware a mask?Use air cleaners?Avoid opening the windows? Drink more orange juice?Live close to a Green space,Change your apartment?Change your genes?03/10/201850Respirami Milano 2017 _ IAM

51. Reduce inequalities between countriesReduce exposure to secondhand smokeReduce occupational exposureReduce urban air polutionImprove indoor air qualityPREVENTION03/10/201851Respirami Milano 2017 _ IAM