/
ATM in California ITS Virginia ATM in California ITS Virginia

ATM in California ITS Virginia - PowerPoint Presentation

atomexxon
atomexxon . @atomexxon
Follow
342 views
Uploaded On 2020-06-25

ATM in California ITS Virginia - PPT Presentation

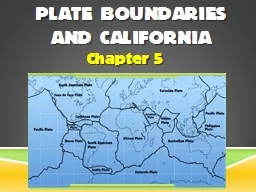
June 5 2014 Presented By Dan Lukasik PE Parsons ATM History in California SR14 Parttime HOV SR118 Parttime use of shoulder as HOV lane Freeway to Freeway connector metering Adaptive Traffic Signal Control ID: 787770

high speed moderate atm speed high atm moderate limit lane good corridor 105 management dynamic traffic hov interchange 110

Share:

Link:

Embed:

Download Presentation from below link

Download The PPT/PDF document "ATM in California ITS Virginia" is the property of its rightful owner. Permission is granted to download and print the materials on this web site for personal, non-commercial use only, and to display it on your personal computer provided you do not modify the materials and that you retain all copyright notices contained in the materials. By downloading content from our website, you accept the terms of this agreement.


Presentation Transcript

Slide1

ATM in CaliforniaITS VirginiaJune 5, 2014Presented By Dan Lukasik, P.E.Parsons

Slide2

ATM History in CaliforniaSR-14 Part-time HOVSR-118 Part-time use of shoulder as HOV laneFreeway to Freeway connector meteringAdaptive Traffic Signal ControlSystem Wide Adaptive Ramp Metering (SWARM) In Los Angeles

Dynamic Lane Management Project at I-110/5 Interchange (Junction Control)

2

Slide3

Current ATM ProjectsIntegrated Corridor ManagementI-880 CorridorSR101 CorridorSan Diego ICMSI-210 (Connected Corridors)South Bay Dynamic Corridor Congestion Management (DCCM)I-80 ICM CorridorI-105 ATM Feasibility Study

3

Slide4

I-80 ICM Project Overview4

4

Slide5

The ProblemOver 20,000 vehicle-hours of delay per day Inconsistent level of service (C to F) Variable speeds (stop & go to 65 mph) High incident rates: over 2,000 incidents annually Un-reliability of travel (20 to>60 min)5

Slide6

The SolutionCreate a Well Balance System Maintain Optimal Operational Viability Proactively Avoid Flow Breakdown Detect and Respond to Congestion Events Faster Improve Safety Manage Congested Flow When it Does Occur Promote Transit Ridership and Mode Shifts Clear Local Arterials from Diversion

6

Slide7

System Implementation7

$5.9M

$32.2M

$2.9M

$24.3M

unfunded

$5.8M

$8.0M

Total Project Cost: $79.1M

Slide8

Adaptive

Ramp Metering

2

Lane Management System

1

I-80

ATM Strategies

3

Variable Speed Assignment Signs (VASS)

4

Queue Warning

8

Slide9

I-80 ATM Strategies9

Dynamic Lane Management

Variable

Speed Advisory Signs

Active Rerouting (Trailblazers)

Real-time

Signal Adjustments (flushing)

Adaptive

Ramp Metering

Active Traffic Management

Transit

Signal Priority

Mode/Route

Shift Choice

Advisories

511 Information

Dissemination

Expanded

Traffic Signal

Coordination

Other ICM Strategies

Slide10

Key I-80 ICM StrategiesAdaptive Ramp MeteringFuzzy Logic AlgorithmActive Traffic ManagementQueue WarningVariable Advisory SpeedIncident ManagementLane ManagementResponse PlansArterial ManagementArterial Trailblazer SignsSignal Timing Flush Plans

10

Slide11

AlgorithmsAdaptive Ramp MeteringSWARMHERO/ALINIEAStratified ZoneFuzzy LogicVariable Speed Advisory SignsThe VASS algorithm will use speed smoothing in its algorithmThe VASS speed smoothing algorithm will be based on an 85th

percentile speed calculationThe speed smoothing algorithm will be automatic with operator monitoring and override features.

Slide12

System IntegrationIntegration of various agency subsystems working togetherArterialFreewayTransitEmergency RespondersIncident Response LUSVASS

Slide13

District 7 ATM Feasibility StudyConduct literature reviewScreen and evaluate suitable freeway corridors and ATM strategiesDevelop and calibrate analysis tools

Use tools to evaluate the corridor-wide impacts and benefits of ATM strategiesDevelop implementation plan for ATM strategies in the selected ATM corridor

Slide14

Task 2: Literature ReviewObjective Synthesize National and international experience with ATM strategiesPotential Benefits (Empirical observations of impacts)Deployment Considerations (Factors contributing to or diluting success of deployment)

Supplement with State and local findings wherever available Supports the identification of likely range of impacts to be carried forward into Task 4

Slide15

Task 2: Literature Review

Slide16

Task 3 - ATM Corridor Assessment - Overview16

Evaluation Criterion

Assessment Rating

I-210 (A)

12mi

SR-134 to I-605

I-210 (B)

15mi

I-605 to Padua Ave

I-710

21mi

Long Beach to Alhambra

I-105

17mi

Sepulveda

Blvd

to I-605

I-405 south

13mi

I-605 to I-110

I-405 mid

8mi

I-110

to I-105

I-405 north

18mi

I-105

to US-101

I-5

10mi

I-605 to SR-60

Congestion and Safety

Peak

period

congestion

levels

High

High

High

Very High

High

Very High

Oversaturated

Oversaturated

Accident rate

Moderate

Moderate

Moderate

High

High

High

High

Moderate

Congestion variability

High

High

High

High

High

High

High

High

Characteristics

Truck traffic

Moderate

Moderate

High

Moderate

Moderate

Moderate

Moderate

Moderate

Diversion potential

Very Good

Very Good

Good

Very Good

Moderate

Poor

Moderate

Good

Shoulders available?

Moderate

Moderate

Poor

Good

Moderate

Moderate

Poor

Moderate

HOV/Managed lanes available?

Good

Good

Poor

Good

Good

GoodGoodPoorRamp/arterial storageGoodGoodGoodExcellentGoodModerateGoodPoorITS InfrastructureHighway detection/surveillanceGoodGoodGoodGoodGoodExcellentGoodGoodArterial detection/surveillanceNoneNoneNoneNoneNoneNoneNoneNoneRamp meteringGoodGoodGoodGoodGoodExcellentExcellentGoodTraveler information disseminationGoodGoodPoorGoodGoodGoodGoodGoodInstitutional CoordinationAgency coordination requiredModerateModerateHighHighLowModerateLowModerateAvailability of ATM ChampionUnknownUnknownUnknownUnknownUnknownTorrance unsupportive?LA or Inglewood?UnknownAvailable Analysis ToolsMesoscopic SimulationNoNoAIMSUN-soonAIMSUN-soonNoAIMSUN-soonNoNoMicroscopic SimulationVISSIMVISSIMAIMSUN-soonAIMSUN-soonParamicsAIMSUN-soon?ParamicsParamicsOverall Potential Opportunity

Slide17

ATM Assessment Framework Deficiency Mapping

Slide18

ATM Assessment Framework Detail Sheets

Slide19

Task 5 - Evaluation of ATM Corridor/LocationPerformance measuresAnalysis scenariosWith/without optimal ATM combinationAssemble dataDevelop/modify analysis toolEvaluate impacts of ATM and estimate benefit-cost

Develop scope for ATM project (concept level design, capital costs, signing, operating plans)

Develop implementation

plan (outreach & education, partnerships, marketing

Develop O&M plan (costs & risks)

Slide20

Queue Warning Example:

I-105 EB approaching

I-110 Interchange

X

SPEED LIMIT

35

SPEED LIMIT

35

Corridor-wide queue warning CMS spaced approx. every ½ to 1 mile

Roadway curvature & frequent speed drops due to I-110 Interchange ahead make this a good location for queue warning

STOPPED TRAFFIC AHEAD

Slide21

Dynamic Lane Management:I-105 EB approaching I-110

Interchange

X

SPEED LIMIT

35

SPEED LIMIT

35

Corridor-wide dynamic lane management approx. every ½ to 1 mile

Roadway curvature and frequent speed drops due to I-110 Interchange ahead make this a good location for queue warning

STOPPED TRAFFIC AHEAD

Slide22

Hard Shoulder Running Example:I-105 WB approaching Long Beach Blvd

SPEED LIMIT

45

SPEED LIMIT

45

Corridor-wide lane control gantries spaced approx. every 1 mile

Video incident detection to verify shoulder unobstructed

USE HARD SHOULDER

Slide23

Active Routing Example

Primary Route

Alternate Route

Diversion Routing

Msg

(Type 2 – DMS)

HAR Messaging (Incident

& Alt. Routing

)

Adjust Ramp Metering Rates

Adjust Signal Timing Plans

Incident & Diversion Routing

Msg

(Type

1 – DMS)

Slide24

Variable Speed Limit Example:I-105 EB

Approaching I-110 Interchange

SPEED LIMIT

35

SPEED LIMIT

35

Corridor-wide variable speed limit signs spaced approx. every ½ to 1 mile

Speed harmonization via VSL can be congestion-, incident-, and weather-responsive

STOPPED TRAFFIC AHEAD

Slide25

Dynamic Junction Control Example:

I-105 EB / I-710 Interchange

Demand responsive lane management for key interchange and ramp bottleneck locations

“Smart Studs“/

Channelizers

Slide26

Predictive Traveler Information Ex:I-105 WB Approaching Long Beach Blvd

DOWNTOWN 55

LAX 30

GREEN LINE LAX 25

Predictive traveler information, generated from historical data and real-time modeling, can be displayed on CMS signs in advance of major decision points (e.g., junctions, transit stops). It can also feed into multimodal DSS.

Slide27

Active Parking Management Example:Norwalk Green Line Station

SPACE AVAIL.

 EAST LOT FULL

 WEST LOT 250

Active parking management can provide travelers real-time parking availability information at the facility or on a mobile application. Parking availability can also be integrated into multimodal decision support systems.

Slide28

Dynamic HOV Example:

I-105 WB Approaching Long Beach Blvd

SPEED LIMIT

45

SPEED LIMIT

45

COLLISION AHEAD

HOV LANE OPEN TO ALL VEHICLES

Corridor-wide

dynamic HOV CMS at each HOV lane entrance location

X

Dynamic HOV can be used to increase occupancy requirements (e.g., from 2 to 3+) in response to congestion in lane or to open the lane to all vehicles in response to roadway incidents blocking GP lanes

X

COLLISION AHEAD

HOV LANE OPEN TO ALL VEHICLES

Slide29

Thank You!Dan Lukasikdaniel.lukasik@parsons.com

714-562-5725