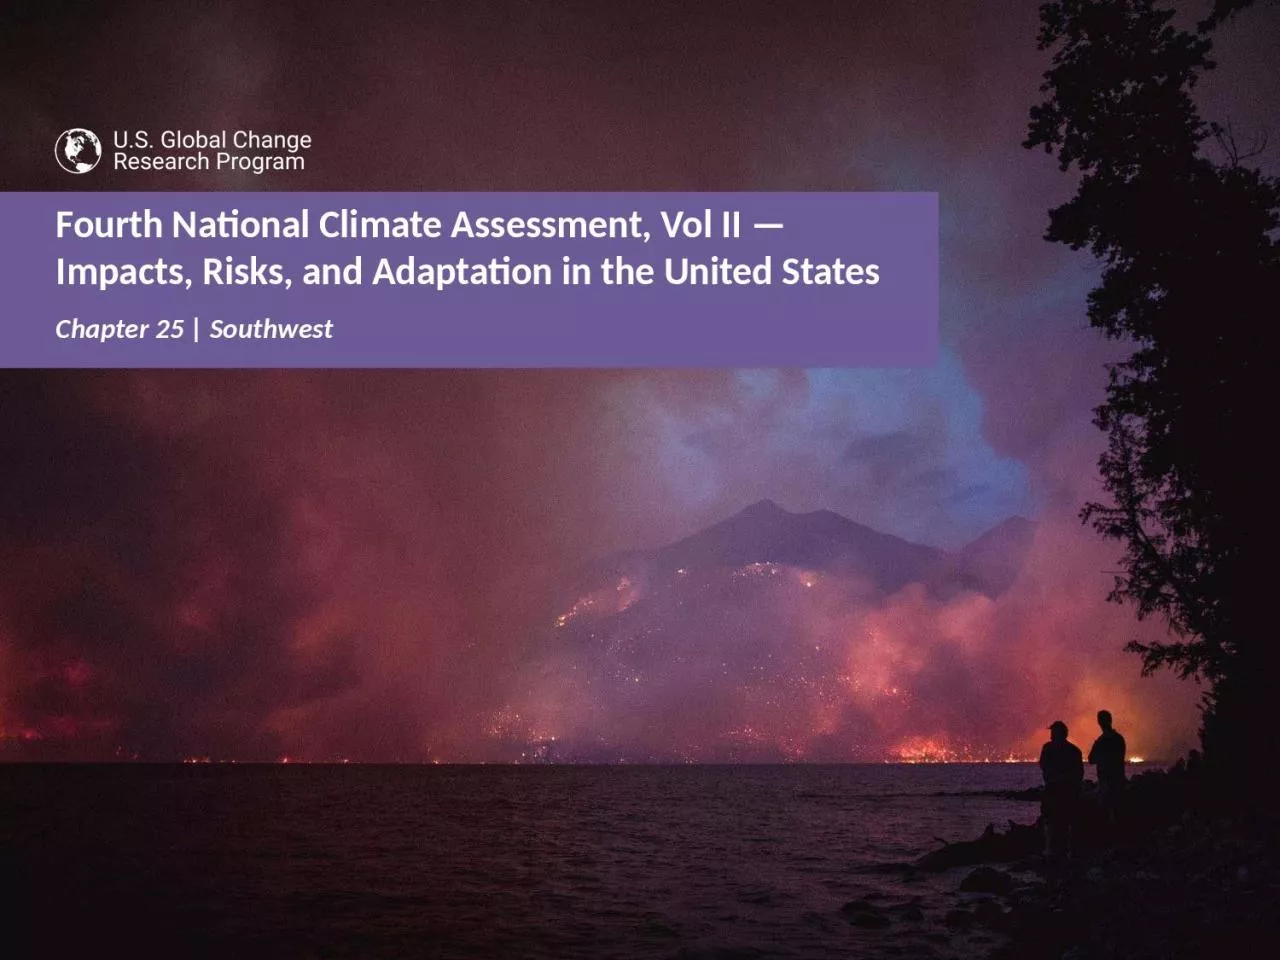
/
Chapter 25 | Southwest Water for people and nature in the Southwest has declined during Chapter 25 | Southwest Water for people and nature in the Southwest has declined during

Chapter 25 | Southwest Water for people and nature in the Southwest has declined during - PowerPoint Presentation

ava
ava . @ava
Follow
347 views
Uploaded On 2022-06-13

Chapter 25 | Southwest Water for people and nature in the Southwest has declined during - PPT Presentation

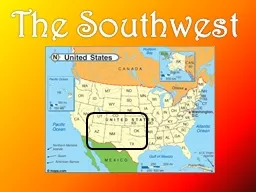
Key Message 1 25 Ch 25 Southwest Water Resources The integrity of Southwest forests and other ecosystems and their ability to provide natural habitat clean water and economic livelihoods have declined as a result of recent droughts and wildfire due in part to humancaused climate change G ID: 917516

water southwest change climate southwest water climate change university risks temperature fig drought increased california heat level increases ocean

Share:

Link:

Embed:

Download Presentation from below link

Download Presentation The PPT/PDF document "Chapter 25 | Southwest Water for people ..." is the property of its rightful owner. Permission is granted to download and print the materials on this web site for personal, non-commercial use only, and to display it on your personal computer provided you do not modify the materials and that you retain all copyright notices contained in the materials. By downloading content from our website, you accept the terms of this agreement.


Presentation Transcript

Slide1

Chapter 25 | Southwest

Slide2

Water for people and nature in the Southwest has declined during droughts, due in part to human-caused climate change. Intensifying droughts and occasional large floods, combined with critical water demands from a growing population, deteriorating infrastructure, and groundwater depletion, suggest the need for flexible water management techniques that address changing risks over time, balancing declining supplies with greater demands.

Key Message #1

25

Ch. 25 | Southwest

Water Resources

Slide3

The integrity of Southwest forests and other ecosystems and their ability to provide natural habitat, clean water, and economic livelihoods have declined as a result of recent droughts and wildfire due in part to human-caused climate change. Greenhouse gas emissions reductions, fire management, and other actions can help reduce future vulnerabilities of ecosystems and human well-being.

Key Message #2

25

Ch. 25 | Southwest

Ecosystems and Ecosystem Services

Slide4

Many coastal resources in the Southwest have been affected by sea level rise, ocean warming, and reduced ocean oxygen—all impacts of human-caused climate change—and ocean acidification resulting from human emissions of carbon dioxide. Homes and other coastal infrastructure, marine flora and fauna, and people who depend on coastal resources face increased risks under continued climate change.

Key Message #3

25

Ch. 25 | Southwest

The Coast

Slide5

Traditional foods, natural resource-based livelihoods, cultural resources, and spiritual well-being of Indigenous peoples in the Southwest are increasingly affected by drought, wildfire, and changing ocean conditions. Because future changes would further disrupt the ecosystems on which Indigenous peoples depend, tribes are implementing adaptation measures and emissions reduction actions.

Key Message #4

25

Ch. 25 | Southwest

Indigenous Peoples

Slide6

The ability of hydropower and fossil fuel electricity generation to meet growing energy use in the Southwest is decreasing as a result of drought and rising temperatures. Many renewable energy sources offer increased electricity reliability, lower water intensity of energy generation, reduced greenhouse gas emissions, and new economic opportunities.

Key Message #5

25

Ch. 25 | Southwest

Energy

Slide7

Food production in the Southwest is vulnerable to water shortages. Increased drought, heat waves, and reduction of winter chill hours can harm crops and livestock; exacerbate competition for water among agriculture, energy generation, and municipal uses; and increase future food insecurity.

Key Message #6

25

Ch. 25 | Southwest

Food

Slide8

Heat-associated deaths and illnesses, vulnerabilities to chronic disease, and other health risks to people in the Southwest result from increases in extreme heat, poor air quality, and conditions that foster pathogen growth and spread. Improving public health systems, community infrastructure, and personal health can reduce serious health risks under future climate change.

Key Message #7

25

Ch. 25 | Southwest

Human Health

Slide9

Fig. 25.1: Temperature Has Increased Across the Southwest

Temperatures increased across almost all of the Southwest region from 1901 to 2016, with the greatest increases in southern California and western Colorado.

23

This map shows the difference between 1986–2016 average temperature and 1901–1960 average temperature.

23

Source: adapted from

Vose

et al. 2017.

23

Ch. 25 | Southwest

Slide10

Fig. 25.2: Actions Responding to Climate Change Impacts and Vulnerabilities

These examples illustrate actions that people, communities, and governments are taking in response to past impacts of climate change and future vulnerabilities.

Coastal protection

: In response to sea level rise and storm surge in San Francisco Bay, federal, state, and local agencies, supported by voter-approved funds, are restoring coastal habitats and levees to protect cities from flooding.

Crop water savings

: The risk of reduced food production increases as climate change intensifies drought. In the Gila River Basin, local government agencies have lined 15 miles (24 km) of irrigation canals to reduce seepage from the canals, saving enough water to irrigate approximately 8,500 acres (3,400 hectares) of alfalfa and other crops each year.

Cultural fire restoration

: Reintroduction of cultural burning by the Yurok Tribe in northern California reduces wildfire risks and protects public and tribal trust resources.

Desert soil restoration

: In Utah, transplanting native and drought-resistant microbial communities improves soil fertility and guards against erosion.

Health protection

: To reduce heat-associated injury and deaths on Arizona trails, the City of Phoenix and Arizona tourism organizations developed a campaign “Take a Hike. Do it Right.” Signs at trailheads and on websites remind hikers to bring water, stay hydrated, and stay aware of environmental conditions.

Ranching and habitat

: The

Malpai

Borderlands Group in Arizona and New Mexico integrates native plant and wildlife conservation into private ranching.

Rooftop solar

: The state governments of California, Colorado, and Nevada have enacted policies that support rooftop solar on homes, which reduces greenhouse gas emissions, improves reliability of the electricity generation system, and creates local small businesses and new jobs.

Water conservation

: Drought in the Colorado River Basin has reduced the volume of water in both Lake Mead and Lake Powell by over half. The United States, Mexico, and state governments have mobilized users to conserve water, keeping the lake above a critical level.

Wildfire fuel reduction

: In response to severe wildfires, the City of Flagstaff, Arizona, enacted a bond to fund reduction of fire fuels in forests around the town.

Source: National Park Service.

Ch. 25 | Southwest

Slide11

Fig. 25.3: Severe Drought Reduces Water Supplies in the Southwest

Since 2000, drought that was intensified by long-term trends of higher temperatures due to climate change has reduced the flow in the Colorado River (top left), which in turn has reduced the combined contents of Lakes Powell and Mead to the lowest level since both lakes were first filled (top right). In the Upper Colorado River Basin that feeds the reservoirs, temperatures have increased (bottom left), which increases plant water use and evaporation, reducing lake inflows and contents. Although annual precipitation (bottom right) has been variable without a long-term trend, there has been a recent decline in precipitation that exacerbates the drought. Combined with increased Lower Basin water consumption that began in the 1990s, these trends explain the recently reduced reservoir contents. Straight lines indicate trends for temperature, precipitation, and river flow. The trends for temperature and river flow are statistically significant.

Sources: Colorado State University and CICS-NC. Temperature and precipitation data from: PRISM Climate Group, Oregon State University,

http://prism.oregonstate.edu

, created 10 Jul 2012.

Ch. 25 | Southwest

Slide12

Fig. 25.4: Climate Change Has Increased Wildfire

The cumulative forest area burned by wildfires has greatly increased between 1984 and 2015, with analyses estimating that the area burned by wildfire across the western United States over that period was twice what would have burned had climate change not occurred.

Source: adapted from

Abatzoglou

and Williams 2016.

7

Ch. 25 | Southwest

Slide13

Fig. 25.5: Sea Level Rise

Sea level rise increases risks to infrastructure. At the Golden Gate Bridge in San Francisco, California, the tidal gauge with the longest time series in the Western Hemisphere shows that sea level has risen nearly 9 inches (22 cm) since 1854 (gray line).

236

,

295

In 1897, the tidal gauge was moved, which caused a slight shift downward of the numerical level but no change in the long-term trend (trends indicated by the blue line). The bars show models projections of sea levels under a higher scenario (RCP8.5; red) and a very low scenario (RCP2.6; green).

Source: National Park Service.

Ch. 25 | Southwest

Slide14

Fig. 25.6: Ocean Temperature Increase

Ocean warming increases risks to fisheries and shellfish. The graph shows observed ocean temperatures of the California Current from measurements (black line); modeled temperatures, extended into the future under the higher scenario (RCP8.5; red line); and the range of 10% to 90% of the 28 models used (pink).

254

,

296

,

297

Source: National Park Service and NOAA

.

Ch. 25 | Southwest

Slide15

Fig. 25.7: Cultural Fire on Yurok Reservation

Andy

Lamebear

, a Yurok Wildland Fire Department firefighter and Yurok tribal member, ignites a cultural burn on the Yurok Reservation. The tribe uses low- to medium- intensity fires to enhance the production of plant-based medicines, traditional basket materials, native fruits, and forage for wildlife. Cultural burning also reduces risks of catastrophic wildfire.

Photo courtesy of the Yurok Tribe.

Ch. 25 | Southwest

Slide16

Fig. 25.8: Electricity Generation Capacity at Risk Under Continued Climate Change

Under a higher emissions scenario (SRES A2

174

), heat-induced reduction of energy efficiency and reduced water flows would reduce summer energy generation capacity across the Southwest region. These projected reductions would increase risks of electricity shortages. The map shows projected changes for the period 2040–2060 compared to the period 1949–2010.

Source: adapted from

Bartos and Chester 2015.

346

Reprinted by permission from Macmillan Publishers Ltd.

Ch. 25 | Southwest

Slide17

Fig. 25.9: Projected Shift in Agricultural Zones

The U.S. Department of Agriculture plant hardiness zones indicate the cold temperature requirements of crops. Increases in temperature under the higher scenario (RCP8.5), would shift these zones northward and upslope, from the period 1976—2005 (left, modeled historical) compared to projections for 2070—2099 (right, average of 32 general circulation models).

Sources: NOAA NCEI and CICS-NC

Ch. 25 | Southwest

Slide18

Fig. 25.10: Projected Increases in Extreme Heat

Under the higher scenario (RCP8.5), extreme heat would increase across the Southwest, shown here as the increase in the average number of days per year where the temperature exceeds 90°F (32°C) by the period 2036–2065, compared to the period 1976–2005.

23

Heat waves increase the exposure of people to heat stroke and other illnesses that could cause death.

30

Source: adapted from

Vose

et al. 2017.

23

Ch. 25 | Southwest

Slide19

Federal Coordinating Lead Author

Patrick Gonzalez,

U.S. National Park ServiceChapter LeadGregg M.

Garfin, University of ArizonaChapter Authors

David D. Breshears, University of Arizona

Keely M. Brooks

,

Southern Nevada Water Authority

Heidi E. Brown

,

University of Arizona

Emile H. Elias

,

U.S. Department of Agriculture

Amrith

Gunasekara

,

California Department of Food and Agriculture

Nancy Huntly

,

Utah State University

Julie K. Maldonado

,

Livelihoods Knowledge Exchange Network

Nathan J. Mantua

,

National Oceanic and Atmospheric Administration

Helene G. Margolis

,

University of California, Davis

Skyli

McAfee

,

The Nature Conservancy (through 2017)

Beth Rose Middleton

,

University of California, Davis

Bradley H. Udall

,

Colorado State University

Review Editor

Cristina

Bradatan

,

Texas Tech University

Chapter Author Team

25

Ch. 25 | Southwest

Slide20

Technical Contributors

Mary E. Black

, University of Arizona

Shallin Busch, National Ocean and Atmospheric Administration

Brandon Goshi, Metropolitan Water District of Southern California

USGCRP Coordinators Fredric Lipschultz,

Senior Scientist and Regional Coordinator

Christopher W. Avery

,

Senior Manager

Acknowledgments

25

Ch. 25 | Southwest

Slide21

Gonzalez,

P., G.M.

Garfin, D.D. Breshears, K.M. Brooks, H.E. Brown, E.H. Elias, A.

Gunasekara, N. Huntly, J.K. Maldonado, N.J. Mantua, H.G. Margolis, S. McAfee, B.R. Middleton, and B.H. Udall, 2018: Southwest. In Impacts, Risks, and Adaptation in the United States: Fourth National Climate Assessment, Volume II [Reidmiller

, D.R., C.W. Avery, D.R. Easterling, K.E. Kunkel, K.L.M. Lewis, T.K. Maycock, and B.C. Stewart (eds.)]. U.S. Global Change Research Program, Washington, DC, USA. doi:

10.7930/NCA4.2018.CH25

https://nca2018.globalchange.gov/chapter/southwest