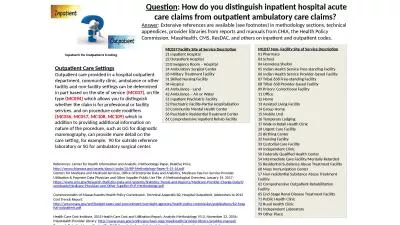
1 Overview 2 Inpatient Hyperglycemia and Poor Outcomes in Numerous Settings Study Patient Population Significant HyperglycemiaRelated Outcomes Pasquel et al 2010 Total parenteral nutrition ID: 759254
Download Presentation The PPT/PDF document "Management of Inpatient Hyperglycemia in..." is the property of its rightful owner. Permission is granted to download and print the materials on this web site for personal, non-commercial use only, and to display it on your personal computer provided you do not modify the materials and that you retain all copyright notices contained in the materials. By downloading content from our website, you accept the terms of this agreement.
Slide1
Management of Inpatient Hyperglycemia in Special Populations
1
Slide2Overview
2
Slide3Inpatient Hyperglycemia and Poor Outcomes in Numerous Settings
StudyPatient PopulationSignificant Hyperglycemia-Related OutcomesPasquel et al, 2010Total parenteral nutrition Mortality risk, pneumonia risk, ARFFrisch et al, 2009Noncardiac surgery Mortality risk, surgery-specific riskSchlenk et al, 2009Aneurysmal SAH Mortality risk; impaired prognosisPalacio et al, 2008All admitted patients, children’s hospital ICU length of stay (LOS), ICU admissionsBochicchio et al, 2007Critically injured/trauma LOS, mortality risk, ventilator time, infection Baker et al, 2006Chronic obstructive pulmonary disease LOS, mortality risk, adverse outcomesMcAlister et al, 2005Community-acquired pneumonia LOS, mortality risk, complicationsUmpierrez et al, 2002All admitted patients (87% non-ICU) LOS, mortality risk, ICU admissions Home discharges
Pasquel FJ, et al. Diabetes Care. 2010;33:739-741; Frisch A, et al. Diabetes. 2009;58(suppl 1):101-OR; Schlenk F, et al. Neurocrit Care. 2009;11:56-63; Palacio A, et al. J Hosp Med. 2008;3:212-217; Bochicchio GV, et al. J Trauma. 2007;63:1353-1358; Baker EH, et al. Thorax. 2006;61:284-289; McAlister FA, et al. Diabetes Care. 2005;28:810-815; Umpierrez GE, et al. J Clin Endocrinol Metab. 2002;87:978-982.
3
Slide4Current Recommendations forHospitalized Patients
All critically ill patients in intensive care unit settingsTarget BG: 140-180 mg/dL Intravenous insulin preferredNoncritically ill patientsPremeal BG: <140 mg/dL Random BG: <180 mg/dL Scheduled subcutaneous insulin preferredSliding-scale insulin discouragedHypoglycemiaReassess the regimen if blood glucose level is <100 mg/dL Modify the regimen if blood glucose level is <70 mg/dL
BG, blood glucose.Moghissi ES, et al. Endocrine Pract. 2009;15:353-369.Umpierrez GE, et al. J Clin Endocrinol Metab. 2012;97:16-38.
4
Slide5PatientS Receiving Enteral Nutrition
5
Slide6Provided to any patient who is malnourished or at risk for general malnutrition (ie, compromised nutrition intake in the context of duration/severity of disease)
EnteralFor patients with intact gastrointestinal (GI) absorptionShort term Nasogastric (NG)NasoduodenalNasojejunalLong term: (PEG) GastrostomyJejunostomy
ParenteralFor patients with or at risk for deranged GI absorption (intestinal obstruction, ileus, peritonitis, bowel ischemia, intractable vomiting, diarrhea)Short term: peripheral access (PPN)Long term: central access (TPN)
Enteral and Parenteral Nutrition
Ukleja A, et al. Nutr Clin Pract. 2010;25:403-414.
6
Slide7Synchronization of Nutrition Support and Metabolic Control Is Important
Nutrition support: to achieve a calorie targetOral (standard and preferred)Enteral (gastrostomy, postpyloric, jejunostomy tubes)Parenteral (IV: peripheral, central)Metabolic control: to achieve a glycemic target Insulin
Nutrition Support + Metabolic Control = Metabolic Support
7
Slide8Enteral Nutrition and Hyperglycemia
Continuous or intermittent delivery of calorie-dense nutrientsWide variety of schedules and formulasAltered incretin physiology (?)Increased risk of hyperglycemiaBasal insulin should be ideal treatment strategy, but…Concerns about potential hypoglycemia after abrupt discontinuation (eg, gastric residuals, tube pulled, etc)Combined basal-regular strategies may be optimal
8
Slide9*Blood glucose >200 mg/dL.
Pancorbo-Hidalgo PL, et al. J Clin Nurs. 2001;10:482-490.
Patients in an acute care hospital on enteral feeding: mean age 76 years; 54.7% female; mean days EN 15 days.
Hyperglycemia Status
Enteral Nutrition: Is It Diabetogenic?
9
Slide10Enteral Nutrition: Insulin Therapy Options
Basal (once or twice daily) + correction insulinBasal + rapid acting every 6 hours + correction insulin
10
Slide11Variable Insulin Regimens Based on Different Types of Enteral Feeding Schedules
Continuous ENBasal: 40%-50% of TDD as long- or intermediate-acting insulin given once or twice a day Short acting 50%-60% of TDD given every 6 hCycled ENIntermediate-acting insulin given together with a rapid- or short-acting insulin with start of tube feedRapid- or short-acting insulin administered every 4-6 hours for duration of EN administrationCorrection insulin given for BG above goal rangeBolus enteral nutritionRapid-acting analog or short-acting insulin given prior to each bolus
BG, blood glucose; EN, enteral; TDD, total daily dose of insulin.
11
Slide12Calculate total carbohydrate calories being given as tube feedsAssess BG every 1 hIf BG <100 mg/dL, give dextrose as D5W or D10W IVContinue dextrose for duration of action of administered insulinExample Patient receiving 80 mL/h of Jevity™ enterally Jevity = 240 mL/8 oz can, containing 36.5 g carb 1 mL Jevity ≈0.15 g (150 mg) carbohydrate @ 80 mL/h ≈12 g Give 120 mL/h D10W or 240 mL/h D5W
100 mL=5 g
100 mL=10 g
Insulin and Enteral Therapy: Coverage Protocol if Tube Feeds Abruptly Stopped
12
Slide13PatientS Receiving Parenteral Nutrition
13
Slide14Mean BG and mortality rate in hospitalized patients on TPN
0
Pre-TPN
24 h TPN
TPN days 2-10
Mortality (%)
<120 120-150 151-180 >180
Mean Blood Glucose (mg/dL)
276 patients receiving TPN
Mean BG
Pre TPN: 123 ± 33 mg/dL
24 h TPN: 146 ± 44 mg/dLTPN days 2-10: 147 ± 40 mg/dL
Pasquel FJ, et al. Diabetes Care. 2010; 33:739-741.
10
50
40
30
20
Glycemia in Patients Receiving TPN
14
Slide15Kumar PR, et al. Gastroenterol Res Pract. 2011;2011. doi:pii: 760720.
StudyCheung (2005)Lin (2007)Sarkisian (2009)Pasquel (2010)Hyperglycemia Definition (mg/dL)>164*>180**≥180***>180****Mortality OR(95%CI)10.90(2.0-60.5)^5.0(2.4-10.6)^7.22 (1.08-48.3)^2.80(1.20-6.80)^Any InfectionOR(95%CI)3.9(1.2-12.0)^3.1(1.5-6.5)^0.9(0.3-2.5)NACardiacOR(95%CI)6.2(0.7-57.8)1.6(0.3-7.2)1.3(0.1-12.5)NAAcute Renal FailureOR(95%CI)10.9(1.2-98.1)^3.0 (1.2-7.7)^1.9(0.4-8.6)2.2 (1.0-4.8)SepticemiaOR(95%CI)2.5(0.7-9.3)NANANAAny ComplicationOR(95%CI)4.3(1.4-13.1)^5.5(2.5-12.4)^NANA^ Significant at P<0.05.* ORs are expressed using blood glucose <124 mg/dL as a reference category.** ORs are expressed using blood glucose <110 mg/dL as a reference category.*** ORs are expressed using blood glucose <180 mg/dL as a reference category.**** ORs are expressed using blood glucose <120 mg/dL as a reference category as measured within 24 h of PN initiation.
TPN, Glucose, and Patient Outcomes
15
Slide16Parenteral Nutrition
Continuous IV delivery of high concentrations of dextrose (20-25 gm/100 mL)No incretin stimulation of insulin secretionHyperglycemia extremely commonBasal insulin should be ideal treatment strategy, but...Concerns about potential hypoglycemia after abrupt discontinuation (eg, technical issues with line)
16
Slide17Parenteral Nutrition: Insulin Therapy Options
Basal (once or twice daily) + correction insulin
Basal + rapid acting every 6 hours + correction insulin
Slide18Should You Stop Insulin Infusionand Put Insulin in the TPN?
Pros
Simplifies number of infusions/linesEasier if patient will be discharged on TPN
Cons
Hard to predict insulin requirement
Once it is in the bag, you cannot take it out
Slide19PatientS on Steroids
19
Slide20Frequency of Hyperglycemia in Patients Receiving High-Dose Steroids
Donihi A, et al. Endocr Pract. 2006;12:358-262.
≥1 BG >200 mg/dL
≥2 BG >200 mg/dL
64
56
81
52
41
75
0
30
60
90
All
No Hx DM
Hx DM
Patients (%)
20
Slide21Steroid Therapy and Inpatient Glycemic Control
Steroids are counterregulatory hormonesImpair insulin action (induce insulin resistance)Appear to diminish insulin secretionMajority of patients receiving >2 days of glucocorticoid therapy at a dose equivalent to ≥40 mg/day of prednisone developed hyperglycemiaNo glucose monitoring was performed in 24% of patients receiving high-dose glucocorticoid therapy
Donihi A, et al. Endocr Pract. 2006;12:358-362.
21
Slide22TES Guidelines for Glucose Control and Glucocorticoid Therapy
The majority of patients (but not all) receiving high-dose glucocorticoid therapy will experience elevations in blood glucose, which are often markedRecommended approachBlood glucose monitoring for patients with or without diabetes receiving glucocorticoid therapyPatients without diabetes: may discontinue BG monitoring if BG remains <140 mg/dL without insulin therapy for 24-28 hUse continuous insulin infusion for patients with severe and persistent BG elevations despite use of scheduled basal-bolus SC insulin
22
BG, blood glucose.
Umpierrez GE, et al.
J Clin Endocrinol Metab
. 2012;97:16-38.
Slide23Steroid Therapy and Glycemic ControlPatients With and Without Diabetes
Patients without prior diabetes or hyperglycemia or those with diabetes controlled with oral agentsBegin BG monitoring with low-dose correction insulin scale administered prior to mealsPatients previously treated with insulinIncrease total daily dose by 20% to 40% with start of high-dose steroid therapyIncrease correction insulin by 1 step (low to moderate dose)
Adjust insulin as needed to maintain glycemic control(with caution during steroid tapers)
23
Slide24PatientS taking U-500 Insulin
24
Slide25U-500 Insulin
When daily insulin requirements exceed 200 units/dayVolume of U-100 injected insulin may be problematicUse of U-500 insulin (5 times more concentrated than U-100 insulin) may be appropriate but switching to U-100 during hospital stay may prevent dosage errorsPossible patientsObstetrics patientsPatients receiving high-dose glucocorticoid therapy Patients with type 2 diabetes, obesity, or severe insulin resistance
25
Kelly JL.
Am J Health-
Syst
Pharm
. 2010;67(
suppl
8):S9-S16.
Slide26Use of U-500 vs U-100 in Hospital Setting
26
U-500 for ≥50% of hospital stay
(n=41)U-500 for <50% of hospital stay(n=20)Median BG, mg/dL 237.6207.9P=0.48Median daily insulin dose20035P<0.001
*P<0.001 vs Group B.BG, blood glucose.Tripathy PR, Lansang C. Endocr Pract. 2015:21:54-58.
*
*
Retrospective Analysis
Days (%)
Slide27Glycemic Control After Switching From U-500 to U-100
27
TDD, total daily dose of insulin.Paulus AO, et al. Endocr Pract. 2016:22:1187-1191.
Retrospective Analysis
Outpatient
Day 1
(n=62)
Day 2
(n=49)
Day 3
(n=35)
Day 4
(n=29)
Day 5
(n=19)
0
50
100
150
200
250
300
0
20
40
60
80
100
120
TDD insulin as percentage of outpatient TDD
Average daily glucose (mg/dL)
Blood glucose
TDD
Slide28PatientS on Insulin Pump therapy
28
Slide29Insulin Pump Therapy
Electronic devices that deliver insulin through a SC catheterBasal rate (variable) + bolus delivery for mealsUsed predominately in type 1 diabetes“Pumpers” tend to be fastidious about their glycemic controlOften reluctant to yield control of their diabetes to the inpatient medical teamHospital personnel typically unfamiliar with insulin pumpsHospitals do not stock infusion sets, batteries, etc, for insulin pumps (multiple models available from different manufacturers
29
Slide30The Challenge of Insulin Pump Usein the Hospital
If patient is clinically stable, awake, alert, and able to independently manage his/her pump, continuation of pump therapy should be consideredBut…many medical-legal issues!And…many obstacles to safe pump therapy in the hospital (trained personnel, equipment, alarms, documentation, etc)Therefore, all hospitals should have a policy for the safe use of insulin pumps at their facilities
30
Slide31Insulin Pump Policy: Main Elements
Patient qualifications for self-management (normal mental status, able to control device, etc)Pump in proper functioning order and supplies stocked by patient/familySigned patient contract/agreementOrder set entryDocumentation of doses delivered (pump flow sheet)Ongoing communication between patient and RNPolicies regarding procedures, surgeries, CTs, MRIs, etc
31
Slide32AACE Position on CSII in the Hospital
32
CSII, continuous subcutatneous insulin infusion.Grunberger G, et al. Endocr Pract. 2014;20:463-489.
A formal inpatient insulin pump protocol reduces confusion and treatment variability
Patients who use CSII outside the hospital may use it inside if:
Patient has the mental and physical capacity to use CSII for self-management
Hospital personnel with CSII expertise are available
Nurses document basal and bolus doses at least daily
Specialist responsible for ambulatory CSII management should be contacted to make decisions about infusion rate adjustments
Slide33Nassar AA, et al. J Diabetes Sci Technol. 2010;4:863-872.
Inpatient Insulin Pump Therapy: A Single Hospital Experience
N=65 patients (125 hospitalizations)Mean age: 57 ± 17 yDiabetes duration: 27 ± 14 yPump use: 6 ± 5 yA1C: 7.3% ± 1.3%Length of stay: 4.7 ± 6.3 days
Pump therapy continued 66%Endocrine consults in 89%Consent agreements in 83%Pump order sets completed in 89%RN assessment of infusion site in 89% Bedside insulin pump flow sheets in only 55%Mean BG 175 mg/dL (same as off pump)No AEs (1 catheter kinking)
33
Slide34A Validated InpatientInsulin Pump Protocol
Physician order setConsult diabetes service/endocrinologistDiscontinue all previous insulin ordersCheck capillary blood glucose frequencyPatient to self-administer insulin via pumpPatient to document all BG and basal/bolus ratesInsulin type order for pump: rapid-acting analog (lispro, aspart, glulisine)Set target BG rangeImplement hypoglycemia treatment protocol
Noschese ML, et al. Endocr Pract. 2009;15:415-424.
34
Slide35Start TimeStopTimeBasal RateUnits/h12 am1 am0.71 am2 am0.72 am3 am0.73 am4 am0.74 am5 am1.05 am6 am1.06 am7 am1.07 am8 am1.0
Start TimeStop TimeBasal RateUnits/h8 am9 am1.09 am10 am1.010 am11 am0.911 am12 pm0.912 pm1 pm0.91 pm2 pm0.92 pm3 pm0.93 pm4 pm0.7
Start TimeStop TimeBasal Rate Units/h4 pm5 pm0.75 pm6pm0.96pm7 pm0.97 pm8 pm0.98 pm9 pm0.9 9 pm10 pm0.910 pm11 pm0.711 pm12 am0.7
Patient to self-administer insulin via SC insulin pump and document all basal rates
Noschese ML, et al. Endocr Pract. 2009;15:415-424.
A Validated InpatientInsulin Pump Protocol
Basal Insulin Rates
35
Slide36A Validated Inpatient Insulin Pump Protocol
Carbohydrate countBreakfast ___ u/per _____gram Lunch ___ u/per _____gram Supper ___ u/per _____gram Snacks ___ u/per _____gram
Fixed doses___ u at Breakfast___ u at Lunch___ u at Supper___ u with Snacks
or
Correction boluses: _____ unit(s) for every ____mg/dL over ____ mg/dL (target glucose)
Noschese ML, et al. Endocr Pract. 2009;15:415-424.
Meal boluses based on:
36
Slide37A Validated Inpatient Insulin Pump Protocol
More inpatient days with BG >300 mg/dL in Group 3 (P<0.02.)No differences in inpatient days with BG <70 mg/dL1 pump malfunction; 1 infusion site problem; no SAEs86% of pumpers expressed satisfaction with ability to manage DM in the hospital
Noschese ML, et al. Endocr Pract. 2009;15:415-424.
Mean BG (mg/dL)P valueGroup 1 - IIPP+DM consult (n=34)173 ±43NSGroup 2 - IIPP alone (n=12)187 ±62Group 3 - Usual care (n=4)218 ±46
Hospitalizations After Implementation of an Inpatient Insulin Pump Protocol (IIPP)
37
Slide38Clinical Outcomes with Inpatient CSII
38
Inpatient mortalityNone reported (only 1 study assessed mortality in 253 patients over 1000 patient-days)HyperglycemiaTrend toward less hyperglycemia with CSIIHypoglycemiaTrend toward more hypoglycemia with CSIILength of stayShorter stay with continued CSII (4.5 days) vs suspended CSII or IV infusion (7 days)Average blood glucoseCSII continued: 175 mg/dL; suspended CSII or IV infusion:178 mg/dL
Systematic Review(N=11 Studies*; 624 Patients)
*9 retrospective; 2 prospective, including 1 randomized, controlled study.
CSII, continuous subcutaneous insulin infusion; IV, intravenous.
Anstey J, et al.
Diabet
Med
. 2015;32:1278-1288.
Slide39Efficacy of CSII in Hospitalized Patients with Type 2 Diabetes
39
*P<0.05 vs day 1.BG, blood glucose; CBG, capillary blood glucose; CSII, continuous subcutaneous insulin infusion; IV, intravenous.Boullu-Sanchis S, et al. Diabetes Metab. 2006;32:350-357.
FPG (mg/dL)
Fasting Plasma Glucose
*
*
No significant differences between treatment groups in
Mean daily CBG levels
Percent of preprandial CBG values in the target range
Daily standard deviation of BG on day 5
Insulin dose lower in CSII group (
P
<0.05)
Hypoglycemia
CSII: 0.06 events/patient per day
IV insulin: 0.015 events/patient per day
Between group difference not statistically significant
No severe hypoglycemia reported in either group
Slide40Results of an Inpatient CSII Protocol
40
IDS, inpatient diabetes service; IPP, inpatient pump protocol.Noschese ML, et al. Endocr Pract. 2009;15:415-424.
IDS + IPP
IPP
No IDS/IPP
N (% female)
34 (32)
12 (50)
4 (75)
Age
48±15
51±16
36±12
LOS (days)
9.8±15.4
5.2±6.2
3±1.5
CSII use (days)
5.4±7.1
3.2±2.9
3±1.5
Mean CBG (mg/dL)
173±43
187±62
218±46
Patient days with
≥1 CBG <70
21
10
20
All CBG 70-180
25
24
24
≥1 CBG 181-300
56
55
73
≥1 CBG >300
22
7
60
Slide41Inpatient CSII Therapy in Patients Treated With Insulin as Outpatients
Patients completing questionnaire (n=17) reported a high degree of satisfaction with their ability to continue CSII therapy in the hospitalThere were 2 CSII related adverse events1 infusion site problem1 pump malfunction
Noschese ML, et al. Endocr Pract. 2009;15:415-424.
41
Slide42Inpatient CSII Therapy
Prevalence of hyperglycemia and hypoglycemia in
inpatients who continued (pump on) or discontinued
(pump off) CSII during their hospital stay
Bailon RM, et al.
Endocr Pract. 2009;15:24-29.
42
Slide43Blood glucose (mg/dL)
Pump On
Pump Off
Values per person
Bailon RM, et al.
Endocr Pract.
2009;15:24-29.
Hyperglycemic Events in Patients Continuing or Stopping CSII Therapy During Their Hospital Stays
43
Slide44Blood glucose (mg/dL)
Pump On
Pump Off
Bailon RM, et al.
Endocr Pract.
2009;15:24-29.
Hypoglycemic Events in Patients Continuing or Stopping CSII Therapy During Their Hospital Stays
44
Slide45Blood Glucose Levels withPeri-operative CSII
45
CBG, capillary blood glucose; CSII, continuous subcutatneous insulin infusion.Sobel SI, et al. Endocr Pract. 2015;21:1269-1276.
Patients with Diabetes Undergoing Same-Day Surgery(N=49)
Mean Post-op CBG
Post-op CBG ≤200 mg/dL
Patients (%)
Blood glucose (mg/dL)
Slide46Inpatient Management of Hyperglycemia: Managing Safety Concerns
Both undertreatment and overtreatment of hyperglycemia create safety concernsAreas of riskChanges in carbohydrate or food intakeChanges in clinical status or medicationsFailure to adjust therapy based on BG patternsProlonged use of SSI as monotherapy Poor coordination of BG testing with insulin administration and meal deliveryPoor communication during patient transfers Errors in order writing and transcription
46
Slide47Perioperative Recommendations
47
Slide48Pre-Op Recommendations for Patients Admitted Day of Surgery: Patients on Noninsulin Agents
Withhold noninsulin agents the morning of surgeryInsulin is necessary to control glucose in patients with BG >180 mg/dL during surgeryNoninsulin agents can be resumed postoperatively when:Patient is reliably taking PORisk of liver, kidney, and heart failure are lower
48
Slide49Pre-op Recommendations for Insulin Treated Patients
Morning of surgery
Give 50-75% of home basal insulin dose (NPH/glargine/detemir)
Do NOT give prandial insulin
Give correction for hyperglycemia
For prolonged procedures initiate insulin infusion
Slide50Pre-op Recommendations:Patients Using Insulin Pump
Discontinue insulin pump and change to IV insulin according to patient’s current basal rateIf basal rate <1 unit/h, start IV insulin at 0.5 units/h If basal rate 1-2 units/h, start IV insulin at 1 units/hMonitor BG hourly, with titration per insulin infusion protocolFor brief surgical procedures in which the pump insertion site is not in surgical field, may consider continuing pump therapyReduce basal rate by 20% (eg, 1 u/h changes to 0.8 u/h)Remove pump and initiate insulin infusion if patient becomes hemodynamically unstableHypoglycemia and hyperglycemia treated in manner similar to that of patients receiving SC insulin pre-op
50
Slide51Medication Adjustment Before Surgery
51
Emory University Protocol
Duggan EW, et al. Curr Diab Rep. 2016;16:34.
Oral agents
Detemir or glargine
NPH or premixed insulin
Short or rapid-acting insulin
Noninsulin injectable agents
Day before surgery
AM: usual dose
PM: usual dose
AM: usual dose
PM: 80% of usual dose
AM: usual dose
PM: 80% of usual dose
AM: usual dose
PM: usual dose
AM: usual dose
PM: usual dose
Day of surgery
Hold
80% of usual dose
50% of usual dose if BG >120 mg/dL
Hold if nothing by mouth
Hold
Slide52Day-of-Surgery Glucose Monitoring
52
Emory University Protocol
BG, blood glucose; OR, operating room; PACU, post-anesthesia care unit; POHA, pre-operative holding area.Duggan EW, et al. Curr Diab Rep. 2016;16:34.
No diabetes
Diabetes
BMI >25 kg/m2 or age >45 years
Yes
No
No further testing
BG in POHA
BG <140 mg/dL
BG ≥140 mg/dL
No further testing
BG in OR q 2 hBG in PACU q 2 h
BG <180 mg/dL
No further testing
BG ≥180 mg/dL
Hospital hyperglycemia protocol
A1CBG in POHABG in OR q 2 hBG in PACU
Slide53Peri-operative Diabetes Management
53
Brigham and Women’s Hospital ProtocolProcedures >1 Hour
BG, blood glucose; HCO3, bicarbonate; IDCS, inpatient diabetes consult service; IV, intravenous; VBG, venous blood gas.Arnold LM, et al. Endocr Pract. 2016:Nov 7 [Epub ahead of print]
BG 181-300
BG ≤180
BG ≥500
BG 301-499
Intermittent IV insulin as needed
OK for surgeryStart insulin drip
Urine dipstick
Cancel caseConsult IDCS
Avoid subcut insulin pre- and post-operatively
Trace or small ketones
Moderate or large ketones
If unable to check dipstick, proceed to VBG
OK for surgery
HCO3 by VBG
>20
≤20
OK for surgeryStart insulin drip
Cancel caseConsult IDCS
Slide54Peri-operative Diabetes Management
54
Brigham and Women’s Hospital ProtocolProcedures >1 Hour
BG, blood glucose; CSII, continuous subcutaneous insulin infusion; D10, dextrose 10%; DS, dextrose solution; IV, intravenous.; NPH, Neutral Protamine Hagedorn.Arnold LM, et al. Endocr Pract. 2016:Nov 7 [Epub ahead of print]
Patient has type 1 diabetes
Is patient using CSII?
No
Yes
Did patient take either detemir or glargine in past 12 h or NPH in past 6 h?
No
Yes
OK for surgeryStart insulin drip
BG ≤180 mg/dL
BG >180 mg/dL
IV insulin every 1 h as needed
Insulin infusion + DS, 40 mL/h
Or
D10, 20 mL/h
Continue CSII + DS, 40 mL/h
Or
D10, 20 mL/h
Slide55Peri-operative Diabetes Management
55
Brigham and Women’s Hospital ProtocolProcedures ≤1 Hour
BG, blood glucose; HCO3, bicarbonate; IDCS, inpatient diabetes consult service; VBG, venous blood gas.Arnold LM, et al. Endocr Pract. 2016:Nov 7 [Epub ahead of print]
BG 181-300
BG ≤180
BG ≥500
BG 301-499
Intermittent IV insulin as needed
OK for surgeryUse sliding scale
Consult with primary team on whether to conduct surgery
Cancel caseConsult IDCS
Avoid subcut insulin pre- and post-operatively
If OK for surgery, use sliding scale
BG (mg/dL)
Regular insulin IV push (units)
≤180
0
181-230
2
231-280
3
281-330
4
331-499
5
>499
Call physician
Slide56Patients receiving an Organ Transplant
56
Slide57Risk Factors for Post–Organ Transplant Hyperglycemia
Traditional Risk Factors
AgeGenderBMINon-white ancestry/ethnicityHepatitis C infectionFamily history of diabetesPre-existing diabetes
Risk Factors Unique to Organ Transplantation
HLA subtype mismatchDeceased donor organsMale donorsCytomegalovirusDiabetogenic effects of immunosuppressive therapy
57
HLA, human leukocyte antigen.
Sadhu A, et al. In:
Managing Diabetes and Hyperglycemia in the Hospital Setting: a Clinician’s Guide
.
Draznin
B, ed. Alexandria, VA: American Diabetes Association; 2016:157-166.
Slide58Post-Transplantation Glucose Control Challenges
Immunosuppressive therapyCorticosteroids increase hepatic gluconeogenesis, peripheral tissue insulin resistance, and insulin secretion from -cellsCalcineurin inhibitors inhibit insulin secretion from -cells and promote -cell apoptosisMammalian target of rapamycin (mTOR) inhibitors decrease insulin secretion and -cell mass, particularly in the hyperglycemic stateUnpredictable post-transplant organ functionAltered medication pharmacokinetics after renal transplantationIncreased gluconeogenesis and glycogenolysis after liver transplantAltered metabolic control due to delays or changes in allograft function
58
Sadhu A, et al. In:
Managing Diabetes and Hyperglycemia in the Hospital Setting: a Clinician’s Guide
.
Draznin
B, ed. Alexandria, VA: American Diabetes Association; 2016:157-166.
Slide59Post-Transplantation Glucose Control Challenges
59
GI, gastrointestinal; mTOR, mammalian target of rapamycin.Sadhu A, et al. In: Managing Diabetes and Hyperglycemia in the Hospital Setting: a Clinician’s Guide. Draznin B, ed. Alexandria, VA: American Diabetes Association; 2016:157-166.
Immunosuppressive therapy
Corticosteroids
Increase hepatic gluconeogenesis and peripheral insulin resistance
Reduce
insulin secretion from -cells
Calcineurin inhibitors
Inhibit insulin secretion from
-cells
Promote -cell apoptosis
mTOR inhibitors: decrease insulin secretion and
-cell mass, particularly in the hyperglycemic state
Post-transplantation organ function
Altered medication pharmacokinetics after renal transplantation
Increased gluconeogenesis and
glycogenolysis
after liver transplant
Altered metabolic control due to delays or changes in allograft function
Nutritional status
Inconsistent calorie absorption due to GI side effects of immunosuppressive drugs
Slide60Post-Transplantation Treatment Recommendations
60
IV, intravenous; NPH, Neutral Protamine Hagedorn.Sadhu A, et al. In: Managing Diabetes and Hyperglycemia in the Hospital Setting: a Clinician’s Guide. Draznin B, ed. Alexandria, VA: American Diabetes Association; 2016:157-166.
Glucose targets
Initial blood glucose target: <180 mg/dL, avoid blood glucose <70 mg/dL
Therapy
IV regular insulin during immediate post-transplantation period (48-96 h after heart, lung, or liver transplant)
Transition to subcutaneous insulin when postoperative progress and nutrition are stable and steroids are decreased
NPH preferred basal insulin because its pharmacodynamics mimic effect of prednisone and
methylprednisone
on glucose
Peak effect 4-8 h after administration, 12-16 h duration of action
Use rapid acting insulin analog for prandial glucose control
Slide61Summary
Hyperglycemia is associated with adverse clinical outcomes in the hospital setting, both in critically ill and noncritically ill patientsNational organizations have promoted safe and achievable glucose targets for inpatientsSpecial considerations are necessary for patientsOn enteral or parenteral nutritionReceiving steroidsUsing insulin pumpsEstablished pre-op procedures are also important to optimize glucose control during surgery
61