/
BODY31WORN CAMERAS IN LAW ENFORCEMENT AGENCIES BODY31WORN CAMERAS IN LAW ENFORCEMENT AGENCIES

BODY31WORN CAMERAS IN LAW ENFORCEMENT AGENCIES - PDF document

brianna
brianna . @brianna
Follow
344 views
Uploaded On 2021-10-11

BODY31WORN CAMERAS IN LAW ENFORCEMENT AGENCIES - PPT Presentation

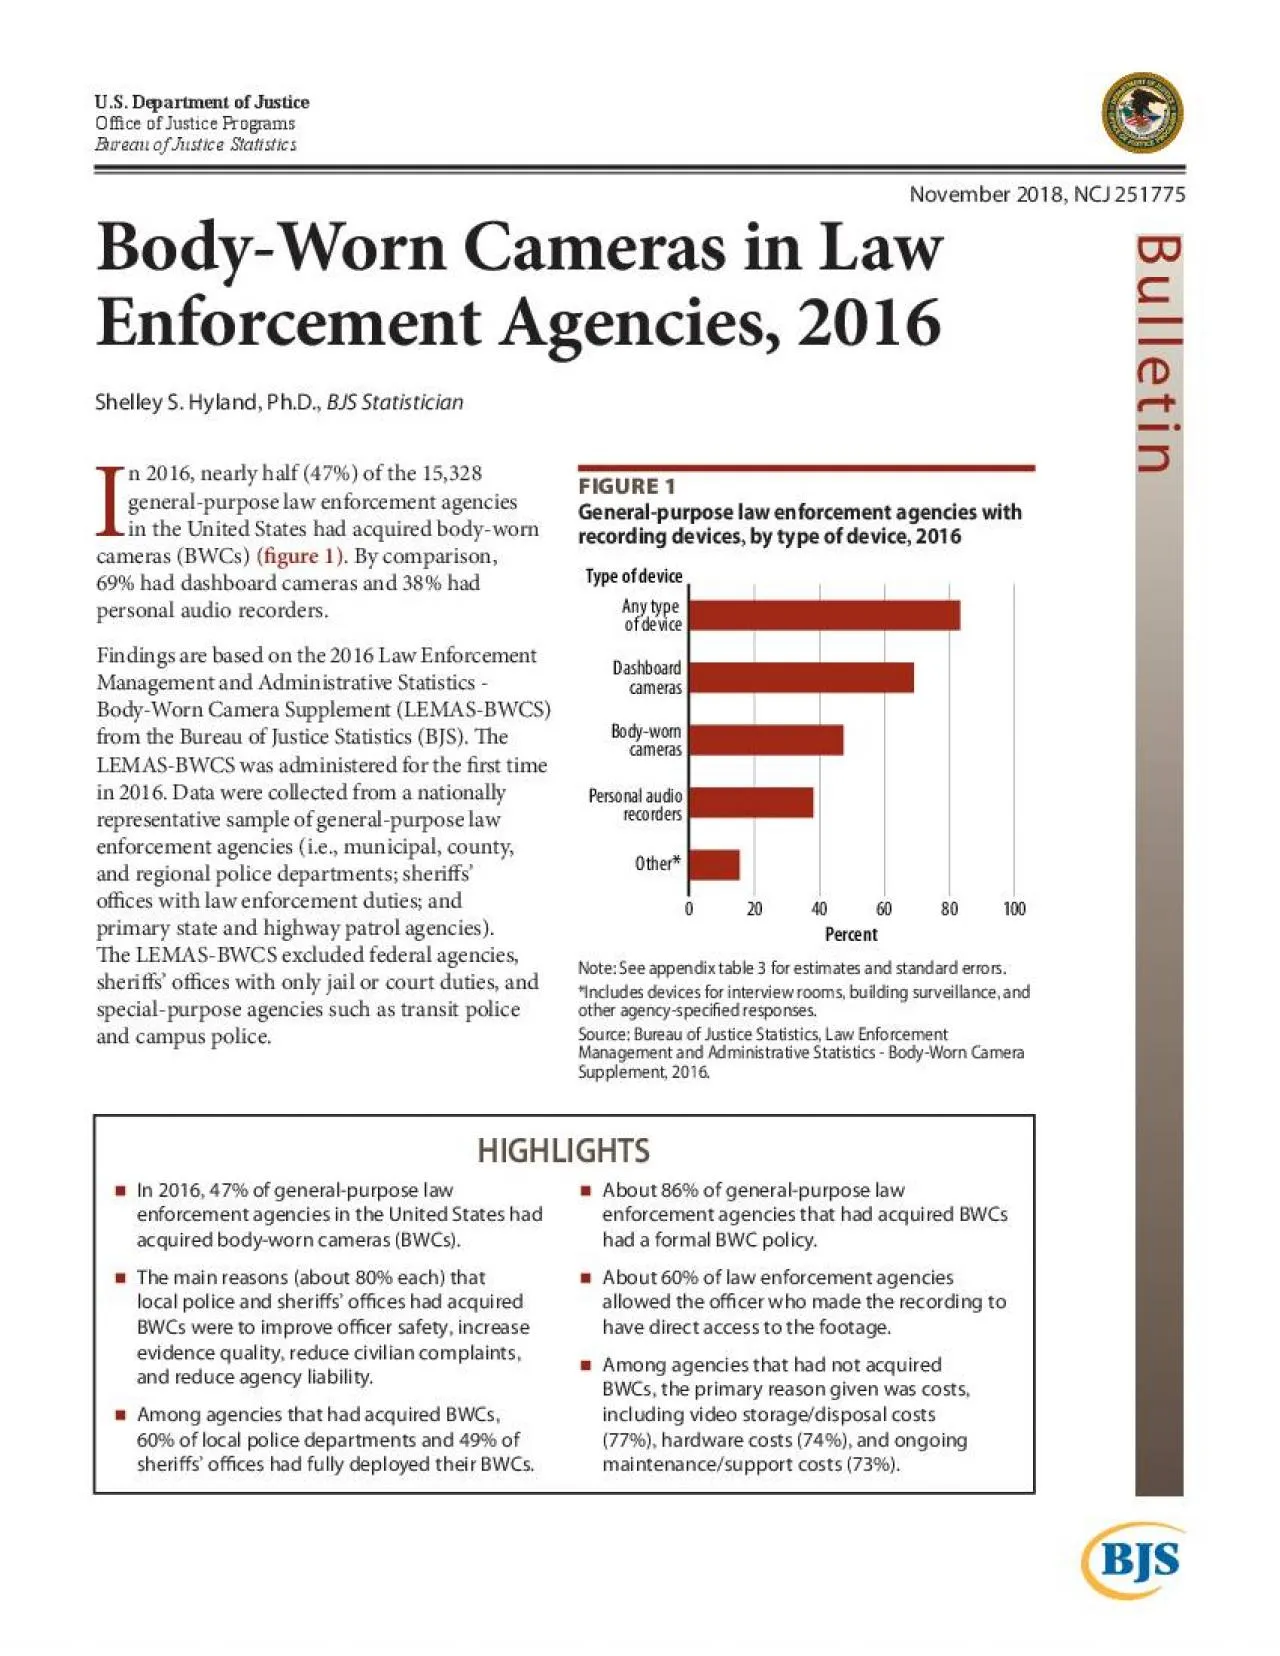
2016 NOVEMBER 2018About 95 of agencies that had acquired BWCs had placed at least one camera in service Among local police departments 48 had acquired BWCs and 45 had at least started deploying them ID: 900026

bwcs agencies 150 police agencies bwcs police 150 worn body 2016 enforcement law cameras local agency 146 sheri cers

Share:

Link:

Embed:

Download Presentation from below link

Download Pdf The PPT/PDF document "BODY31WORN CAMERAS IN LAW ENFORCEMENT AG..." is the property of its rightful owner. Permission is granted to download and print the materials on this web site for personal, non-commercial use only, and to display it on your personal computer provided you do not modify the materials and that you retain all copyright notices contained in the materials. By downloading content from our website, you accept the terms of this agreement.


Presentation Transcript

1 BODYWORN CAMERAS IN LAW ENFORCEMENT
BODYWORN CAMERAS IN LAW ENFORCEMENT AGENCIES , 2016 | NOVEMBER 2018 About 95% of agencies that had acquired BWCs had placed at least one camera in service. Among local police departments, 48% had acquired BWCs and 45% had at least started deploying them (table 1) . About 46% of sheris’ oces had acquired BWCs and 44% had placed BWCs in service. About 27% of primary state police agencies had acquired and at least started deploying BWCs. About 80% of the largest local police departments (employing 500 or more full-time sworn ocers) had acquired BWCs, and 70% had at least started placing the BWCs service. In comparison, about 31% of local police departments employing only part-time sworn ocers had acquired BWCs and had placed BWCs in service. Among the largest sheris’ oces (those with 500 or more full-time sworn ocers), about 58% had acquired BWCs and 53% had at least started deploying them. About 44% of the smallest sheris’ oces (those with 1 to 24 full-time sworn ocers) had acquired BWCs and had placed BWCs in service. TABLE 1 Agencies that had acquired and started using body-worn cameras , by agency type and size , 2016 Type and size of agency Number of agencies Acquired BWCs a At least some BWCs in service b Total 15 , 328 47.4 % 44.7 % Local police 12 , 267 47.7 % 45.1 % 1 , 000 or more 45 80.5 78.0 500–999 53 79.6 63.3 250–499 97 62.9 60.7 100–249 470 55.7 52.7 50–99 845 42.4 39.3 25–49 1 , 614 41.6 39.7 10–24 2 , 920 47.6 44.6 5–9 2 , 435 51.3 48.6 1–4 3 , 530 48.1 45.8 0 c 259 30.7 30.7 Sheri ’ s oce 3 , 012 46.4 % 43.7 % 1 , 000 or more 18 66.7 60.0 500–999 28 52.2 47.8 250–499 95 55.9 50.8 100–249 223 46.4 40.9 50–99 356 47.8 43.0 25–49 624 48.6 45.9 10–24 911 44.5 43.6 5–9 554 44.6 40.7 1–4 203 44.1 44.1 Primary state police 49 26.5 % 26.5 % Note: Details may not sum to totals due to rounding. See appendix table 4 for standard errors. a Agency responded “ agency has acquired in any form (including testing) ” body-worn cameras. b Agency reported at least one body-worn camera that was currently in service or being used in the eld. c Includes agencies with no full-time sworn ocers and only part-time sworn ocers. Source: Bureau of Justice Statistics , Law Enforcement Management and Administrative Statistics - Body-Worn Camera Supplement , 2016. Characteristics of body-worn cameras Body-worn cameras (BWCs) are small , transportable devices worn by ocers to record interactions with the public. The cameras can be attached to an ocer ’ s clothing , sunglasses , or helmet. BWCs can produce video and audio recordings. The footage is saved on a local storage device or uploaded to a web-based storage platform. Some BWCs can upload video while in the eld. Unlike dashboard cameras , BWCs are not xed to law enforcement vehicles and allow for video recording wherever the ocer is. According to the Bureau of Justice Assistance , BWCs vary by a number of characteristics

2 , “ including battery-life lengt
, “ including battery-life length , event marking , weight , camera placement , camera size , quality of video , vision type (day or day/ night) , eld of view , playback capacity , charge time , pre-event recording , law enforcement radio interface , video and audio format , video safeguards , download capability , and cost. ” 1 1 Bureau of Justice Assistance. (2015). Body-worn Camera Toolkit: FAQs. Washington, DC: U.S. Department of Justice. BODYWORN CAMERAS IN LAW ENFORCEMENT AGENCIES , 2016 | NOVEMBER 2018 Among general-purpose agencies with BWCs , about 119 , 000 BWCs were in service In 2016, there were nearly 415,000 full-time sworn ocers in those general-purpose agencies that had acquired BWCs (table 2) . Within these agencies, there were about 119,000 BWCs currently in service (29 BWCs per 100 full-time sworn ocers). Agencies with BWCs reported that an additional 86,000 BWCs would be deployed within the next 12 months (21 BWCs per 100 full-time sworn ocers). In local police departments, there were about 90,000 BWCs in service (30 BWCs per 100 full-time sworn ocers) and another 68,000 slated to be deployed in the next 12 months (22 BWCs per 100 full-time sworn ocers). In 2016, sheris’ oces had more than 28,000 BWCs in service (29 BWCs per 100 full-time sworn ocers) and planned to deploy another 17,000 BWCs within the next 12 months (18 BWCs per 100 full- time sworn ocers). Among the 13 primary state police agencies with BWCs, about 2,700 BWCs were either in service or were slated to be in the next 12 months. More than 8 in 10 (82%) general-purpose law enforcement agencies with BWCs acquired BWCs in part to improve ocer safety General-purpose law enforcement agencies gave a variety of reasons for having acquired BWCs. e most common reasons given (about 80% each) were to improve ocer safety, improve evidence quality, reduce civilian complaints, and reduce agency liability (table 3) . Other TABLE 2 Full-time sworn ocers with body-worn cameras , by agency type , 2016 Type of agency Number of full-time sworn ocers in agencies with BWCs BWCs in service BWCs to be deployed within the next 12 months Number BWCs per 100 full-time sworn ocers* Number BWCs per 100 full-time sworn ocers* Overall 414 , 504 119 , 399 29 86 , 377 21 Local police 304 , 800 90 , 149 30 67 , 535 22 Sheri ' s oce 96 , 262 28 , 368 29 17 , 035 18 Primary state 13 , 442 882 7 1 , 807 13 Note: See appendix table 5 for standard errors. *Number of body-worn cameras (BWCs) divided by the total number of full-time sworn ocers in agencies that have acquired BWCs , times 100. Source: Bureau of Justice Statistics , Law Enforcement Management and Administrative Statistics Body Worn Camera Supplement , 2016. TABLE 3 Reasons why body-worn cameras were acquired , by agency type and size , 2016 Agencies with BWCs a Local police Sheri ’ s oce Reason Total 500 or more 100–499 25–99 0–24 b Total 500 or more 100–499 25–99

3 1–24 Improve ocer safety 81.6
1–24 Improve ocer safety 81.6 % 82.1 % 72.2 % 75.0 % 77.5 % 83.8 % 80.3 % 72.7 % 73.0 % 79.6 % 82.6 % Reduce/resolve civilian complaints 80.7 81.4 80.6 77.1 87.6 80.3 78.5 72.7 79.1 80.4 77.4 Improve evidence quality 78.6 77.9 66.7 68.9 74.7 79.5 81.5 72.7 73.0 77.6 86.2 Reduce agency liability 77.6 78.6 72.2 68.7 77.7 79.6 74.1 63.6 69.9 71.5 77.0 Improve ocer/agency accountability 73.5 73.5 80.6 80.4 76.0 72.3 73.6 77.3 74.5 74.6 72.7 Make cases more prosecutable 69.6 68.6 61.1 56.8 62.8 71.0 73.8 40.9 ! 58.9 69.5 80.9 Improve ocer professionalism 60.1 60.3 66.7 64.3 62.8 59.4 59.6 68.2 52.8 59.5 60.9 Improve community perceptions 56.7 58.2 75.0 71.3 67.2 54.9 50.3 68.2 53.0 61.3 42.1 Simplify incident review 50.3 49.9 38.9 38.1 50.0 50.9 52.1 22.7 ! 37.0 46.0 60.3 Improve training 48.8 48.9 61.1 59.5 55.5 46.3 48.6 50.0 58.9 48.9 46.2 Reduce use of force 33.8 34.2 62.5 45.0 36.7 32.3 32.8 50.0 41.6 35.4 28.7 Strengthen police leadership 24.5 25.1 23.6 19.9 25.8 25.3 22.5 18.2 ! 18.6 25.3 21.7 Pilot testing only 17.3 17.3 45.8 35.2 22.4 14.3 16.9 40.9 ! 30.1 20.5 10.9 Other c 15.5 15.7 26.4 19.3 18.2 14.6 14.3 13.6 ! 17.9 14.0 13.8 Number of agencies with BWCs 7 , 259 5 , 847 78 322 1 , 030 4 , 416 1 , 399 26 157 473 742 Note: Details do not sum to 100% due to non-mutually exclusive categories. The categories of reasons given were response options provided on the questionnaire , and agencies were asked to select all that apply. See appendix table 6 for standard errors. ! Interpret with caution. Too few cases to provide a reliable rate , or coecient of variation is greater than 50%. a Includes the 13 primary state police agencies that acquired body-worn cameras (BWCs). These had too few cases to show individual results. b Includes agencies with no full-time sworn ocers and only part-time sworn ocers. c Includes to receive BWC funding , to relieve external pressure , to supplement or replace dashboard cameras , to increase citizen accountability , because BWCs were donated or free , and other agency-specied responses. Source: Bureau of Justice Statistics , Law Enforcement Management and Administrative Statistics - Body-Worn Camera Supplement , 2016. BODYWORN CAMERAS IN LAW ENFORCEMENT AGENCIES , 2016 | NOVEMBER 2018 reasons commonly given were to improve accountability (73%), make cases more prosecutable (70%), improve ocer professionalism (60%), and improve community perceptions (57%). About 34% acquired BWCs in part to reduce use of force. Among local police departments, improving ocer safety (82%), reducing or resolving civilian complaints (81%), reducing agency liability (79%), and improving evidence quality (78%) were the most common reasons reported for acquiring BWCs. About 63% of the largest local police departments (500 or more full-time sworn ocers) acquired BWCs partly to reduce use of force, compared to 32% of the smallest (0 to 24 full-time sworn ocers) local police departments. About four in ve sheris’ oces that had acquired BWCs reported improving evidence quality (82%), improving o

4 8;cer safety (80%), and reducing civilia
8;cer safety (80%), and reducing civilian complaints (79%) as reasons for acquiring the cameras. About 81% of the smallest sheris’ oces (1 to 24 full- time sworn ocers) had acquired BWCs in part to make cases more prosecutable. Eight of the 13 primary state police agencies with BWCs had acquired the cameras for pilot testing only (not shown). About 57% of general-purpose law enforcement agencies with BWCs had fully deployed them to all intended personnel In 2016, more than half (57%) of general-purpose law enforcement agencies that had acquired BWCs had fully deployed them to all intended personnel (table 4) . About 60% of local police departments that had acquired BWCs had fully deployed them to all intended personnel, with about two-hs of local agencies having either partially deployed their BWCs (19%) or having deployed them on a pilot basis (18%). Sixty-four percent of local police departments with BWCs and 0 to 24 full-time sworn ocers (some local agencies only had part-time sworn ocers) had their BWCs fully deployed, while 85% of the largest local police departments (500 or more full-time sworn ocers) had either partially deployed their BWCs (43%) or had deployed them on a pilot basis (42%). Nearly half (49%) of sheris’ oces had fully deployed their BWCs. About 62% of the smallest sheris’ oces (1 to 24 full-time sworn ocers) had fully deployed their BWCs, while about 46% of the largest sheris’ oces (500 or more full-time sworn ocers) had deployed them on a pilot basis. TABLE 4 Deployment of body-worn cameras among agencies that had acquired BWCs , by agency type and size , 2016 Type and size of agency Full a Partial b Exploratory/ pilot Unsure/ don ' t know c Missing c Total d 57.3 % 20.4 % 18.7 % 3.0 % 0.6 % Local police 59.5 % 18.8 % 18.2 % 3.0 % 0.6 % 500 or more 12.5 ! 43.1 41.7 2.8 ! 0.0 100–499 28.1 32.7 37.8 1.3 ! 0.0 25–99 53.1 19.5 24.9 1.7 ! 0.8 0–24 e 64.1 17.2 14.8 3.4 0.6 Sheri ’ s oce 48.8 % 27.1 % 20.2 % 3.3 % 0.7 % 500 or more 18.2 ! 36.4 ! 45.5 0.0 0.0 100–499 21.7 38.0 36.2 3.3 ! 0.8 25–99 38.5 35.8 20.7 4.2 ! 0.8 1–24 62.2 18.8 15.5 2.9 ! 0.6 Note: Includes all agencies that had acquired body-worn cameras (BWCs ; 7 , 259). See appendix table 7 for standard errors. ! Interpret with caution. These had too few cases to provide a reliable rate , or coecient of variation is greater than 50%. a Includes agencies that reported “ full deployment to all intended personnel. ” b Includes agencies that reported “ partial deployment ” or “ complete deployment for some assignments/partial deployment in others. ” c Among the 7 , 259 agencies that had acquired BWCs , 0.6% (43 agencies) did not answer the question about whether the BWCs had been deployed , whereas 3.0% (220 agencies) answered that they were unsure or didn ’ t know if the BWCs had been deployed. d Includes the 13 primary state police agencies that acquired BWCs. These had too few cases to show individual results. e Incl

5 udes agencies with no full-time sworn o&
udes agencies with no full-time sworn ocers and only part-time sworn ocers. Source: Bureau of Justice Statistics , Law Enforcement Management and Administrative Statistics - Body-Worn Camera Supplement , 2016. BODYWORN CAMERAS IN LAW ENFORCEMENT AGENCIES , 2016 | NOVEMBER 2018 Among general-purpose law enforcement agencies that had not fully deployed their BWCs , 63% reported it was due to insucient funding Insucient funding was the most common reason all three types of law enforcement agencies gave for not fully deploying their acquired BWCs to all intended personnel. Among general-purpose law enforcement agencies that had not fully deployed BWCs, about 61% of local police departments and 71% of sheris’ oces stated they had insucient funding for fully deploying cameras to all intended personnel (see appendix table 1). Technology challenges, such as lack of data storage and the inability to acquire sucient hardware, were reported as reasons for not having fully deployed BWCs by about half of local police departments (50%) and sheris’ oces (51%). About 86% of general-purpose law enforcement agencies that had acquired BWCs had a formal BWC policy In 2016, about 86% of all general-purpose law enforcement agencies that had acquired BWCs had a formal policy or were in the process of developing a policy on the use of BWCs (table 5) . About 86% of local departments and 84% of sheris’ oces that had acquired BWCs had a formal policy or a dra form. Of the 13 primary state police agencies that had acquired BWCs, 12 had a formal policy or one in dra form (not shown). Among general-purpose law enforcement agencies with BWCs and a BWC policy, more than four in ve included guidelines on what specic events to record (84%) and on video transfer, storage, and disposal (87%). About 81% of local departments and 76% of sheris’ oces included the frequency for video upload and ooad in their BWC policy. TABLE 5 Policy topics related to body-worn cameras , by agency type and size , 2016 Type and size of agency Number with BWCs Percent with BWC policy a Number with BWC policy Among agencies with a BWC policy , percent that covered— Video transfer , storage , or disposal Specic events to record Video upload/ ooad frequency Routine supervisor review of footage Ocer review of footage Public release of raw (unredacted) footage Informing citizens they are being recorded Content that must be redacted Total b 7 , 259 85.9 % 6 , 235 87.2 % 84.3 % 79.8 % 76.7 % 64.2 % 54.0 % 45.2 % 40.5 % Local police 5 , 847 86.2 % 5 , 042 87.7 % 84.9 % 80.7 % 78.0 % 65.4 % 54.8 % 47.1 % 41.6 % 500 or more 78 97.2 76 92.9 97.1 87.1 87.1 91.4 65.7 68.6 38.6 100–499 322 95.3 307 95.8 95.0 89.0 87.3 84.4 67.4 66.7 49.3 25–99 1 , 030 91.4 942 94.3 92.5 91.5 85.8 81.7 62.6 59.5 49.1 0–24 c 4 , 416 84.2 3 , 717 85.3 81.8 77.2 75.1 59.2 51.6 41.9 39.1 Sheri ’ s oce 1 , 399 84.4 % 1 , 181 85.2 % 82.1 % 76.4 % 71.0 % 58.7 % 50.4 % 37.1

6 % 35.8 % 500 or more 26 95.5 25 90.5 9
% 35.8 % 500 or more 26 95.5 25 90.5 95.2 90.5 90.5 76.2 52.4 71.4 33.3 ! 100–499 157 89.0 140 92.8 84.8 86.8 84.2 71.9 61.3 46.7 44.4 25–99 473 87.8 415 86.9 82.3 77.2 66.5 61.4 48.7 35.4 31.4 1–24 742 81.0 601 82.0 80.7 72.8 70.1 53.1 48.9 34.5 37.0 Note: Based on number and percent of agencies. Details do not sum to totals due to non-mutually exclusive categories. Policy categories were response options provided on the questionnaire , and agencies were asked to select all that apply. See appendix table 8 for standard errors. ! Interpret with caution. Too few cases to provide a reliable rate , or coecient of variation is greater than 50%. a Includes agencies that have a formal policy (62.4%) or one under development (23.5%). b Includes the 13 primary state police agencies that acquired body-worn cameras (BWCs). These had too few cases to show individual results. c Includes agencies with no full-time sworn ocers and only part-time sworn ocers. Source: Bureau of Justice Statistics , Law Enforcement Management and Administrative Statistics - Body-Worn Camera Supplement , 2016. BODYWORN CAMERAS IN LAW ENFORCEMENT AGENCIES , 2016 | NOVEMBER 2018 More than 45% of these agencies’ BWC policies included informing citizens when they are being recorded. BWC policies in about 47% of local police departments and 37% of sheris’ oces included informing citizens when they are being recorded. 9 in 10 general-purpose law enforcement agencies with BWC policies on what events to record required ocers to turn on their BWCs during trac stops Among general-purpose law enforcement agencies with BWCs, a formal BWC policy even in dra form, and a policy including what events to record, 93% required BWCs to record trac stops (table 6) . More than 90% of local police departments and sheris’ oces required ocers with BWCs to record trac stops. About 85% of general-purpose law enforcement agencies with BWCs that covered what to record in their BWC policies required ocers to record ocer-initiated citizen contacts, and the same percentage required ocers to record the execution of arrests or search warrants. Ocers were required to record the transporting of oenders in about 53% of local police departments and 39% of sheris’ oces. TABLE 6 Events that body-worn cameras are required to record , by agency type , 2016 Type of event Total a Local police Sheri ’ s oce Trac stops 92.9 % 93.2 % 91.9 % Ocer-initiated citizen contacts 84.5 84.8 83.6 Executing arrest/search warrants 84.5 84.6 84.8 Firearms deployments 84.0 85.0 79.7 Responding to routine service calls 78.9 79.4 77.0 Criminal investigations 71.9 72.8 67.9 Public-order policing 53.7 53.9 53.4 Special operations 53.5 54.0 51.9 Transporting oenders 50.1 52.6 39.1 Policing public events 26.5 27.0 24.5 Other b 9.6 9.5 9.9 Number of agencies with BWCs and a policy covering events to record c 5 , 259 4 , 280 969 Note: Details do not sum to 100% due to non-mutually exclusive categories. Event categor

7 ies were response options provided on t
ies were response options provided on the questionnaire , and agencies were asked to select all that apply. See appendix table 9 for standard errors. a Includes the 13 primary state police agencies that acquired body-worn cameras (BWCs). These had too few cases to show individual results. b Includes any situation , ocer ’ s discretion , emergency responses , and other agency-specied responses. c Includes all agencies that have acquired BWCs , have a formal policy even in draft form which may or may not be in eect , and the BWC policy includes what events to record. Source: Bureau of Justice Statistics , Law Enforcement Management and Administrative Statistics - Body-Worn Camera Supplement , 2016. BODYWORN CAMERAS IN LAW ENFORCEMENT AGENCIES , 2016 | NOVEMBER 2018 About 60% of general-purpose law enforcement agencies with BWCs allowed the ocer who made the recording direct access to the video More than four in ve (88%) of general-purpose law enforcement agencies allowed the chief executive (such as the police chief, sheri, or commissioner) to have direct access to the BWC video les without having to le a formal request (table 7) . Almost 90% of local police departments allowed the chief executive to access the video les. Among sheris’ oces, 84% of agencies with 1 to 24 full-time sworn ocers and 75% with 500 or more ocers allowed the sheri to have direct access. About 60% of general-purpose law enforcement agencies allowed the ocer who made the recording direct access to the video les without having to le a formal request. Among agencies with 500 or more full-time sworn ocers, 86% of local police departments and 80% of sheris’ oces allowed ocers who made the recording to have direct access. One in ve (20%) general-purpose law enforcement agencies allowed the district attorney direct access to BWC footage. About 26% of sheris’ oces and 18% of local police departments that had acquired BWCs allowed the district attorney to access BWC video footage without ling a formal request. TABLE 7 Personnel with direct access to video produced by body-worn cameras , by agency type and size , 2016 Personnel with direct access to video Type and size of agency Number with BWCs in service Chief executive a Executive sta Ocer made recording Supervisor of ocer that made recording Internal aairs Head of information technology District attorney ’ s oce Other employed sworn ocers Other information technology sta Other non-sworn employees Other b Total c 6 , 857 88.0 % 60.9 % 59.8 % 57.2 % 34.9 % 24.1 % 19.6 % 19.1 % 11.2 % 8.1 % 3.9 % Local police 5 , 529 89.7 % 59.2 % 59.1 % 55.9 % 34.9 % 22.5 % 18.0 % 19.0 % 10.6 % 8.3 % 4.1 % 500 or more 68 85.7 84.1 85.7 84.1 90.5 66.7 38.1 36.5 54.0 22.2 19.0 100–499 306 85.4 84.4 76.5 74.7 79.3 46.9 18.8 24.2 28.4 14.3 9.6 25–99 972 90.8 89.9 65.2 76.5 70.0 44.3 17.4 17.3 21.4 13.2 4.7 0–24 d 4 , 182 89.8 49.9 55.9 49.2 22.6 14.9 17.8 18.7

8 6.1 6.5 3.4 Sheri ’ s oc
6.1 6.5 3.4 Sheri ’ s oce 1 , 315 81.3 % 68.1 % 62.8 % 62.4 % 34.6 % 30.9 % 26.5 % 19.4 % 13.2 % 7.3 % 3.1 % 500 or more 24 75.0 75.0 80.0 80.0 75.0 60.0 30.0 ! 25.0 ! 45.0 ! 10.0 ! 5.0 ! 100–499 140 69.3 69.9 58.2 65.0 67.9 49.6 18.9 12.9 25.8 10.3 7.7 ! 25–99 439 80.4 77.1 64.1 64.0 46.5 43.9 24.1 20.0 16.6 7.3 ! 4.5 ! 1–24 712 84.4 62.0 62.3 60.2 19.4 18.3 29.2 20.2 7.6 6.6 1.2 ! Note: Data are based on number and percentage of agencies. Direct access is dened as having access to the les without ling a formal request. Details do not sum to totals due to non-mutually exclusive categories. Personnel categories were response options provided on the questionnaire , and agencies were asked to select all that apply. See appendix table 10 for standard errors. ! Interpret with caution. Too few cases to provide a reliable rate , or coecient of variation is greater than 50%. a Includes police chiefs , sheris , or commissioners. b Includes undetermined/pending , vendor sta , and other agency-specied responses. c Includes the 13 primary state police agencies that acquired body-worn cameras (BWCs). These had too few cases to show individual results. d Includes agencies with no full-time sworn ocers and only part-time sworn ocers. Source: Bureau of Justice Statistics , Law Enforcement Management and Administrative Statistics - Body-Worn Camera Supplement , 2016. BODYWORN CAMERAS IN LAW ENFORCEMENT AGENCIES , 2016 | NOVEMBER 2018 Nearly one in ve (18%) general-purpose law enforcement agencies with BWCs reported that the public had never requested video footage In 2016, about 63% of general-purpose law enforcement agencies that had acquired BWCs had, on average, no public requests for video footage per month or had never received a request from the public to obtain video generated from BWCs (table 8) . About a h of agencies (21%) received an average of one to ve requests from the public per month for BWC video footage. About 21% of local police departments and 19% of sheris’ oces with BWCs received one to ve such requests per month. Of those agencies that had BWCs and at least one request on average per month, 75% reported it took less than 2 hours to produce video footage for the public. About 39% of local police departments said it took less than one hour on average to produce the video, while 41% of sheris’ oces said it took an average of one to 2 hours to produce the video (not shown). In 2016, among the general-purpose law enforcement agencies that had BWCs and averaged at least one public request per month, 41% had denied public access to BWC video footage (not shown). e most common reason cited was that the video was part of an ongoing investigation. More than 9 in 10 local police agencies (92%) and sheris’ oces (99%) denied a public request citing this reason (not shown). Concerns about privacy were the most common obstacle associated with using cameras or video in agencies with BWCs In 2016, about a third (35%) of general-purp

9 ose law enforcement agencies that had a
ose law enforcement agencies that had acquired BWCs said privacy concerns were an obstacle to using cameras or the associated video (table 9) . About 36% of local police departments and 28% of sheris’ oces had concerns about privacy. Greater costs than anticipated and concerns about procedures surrounding video storage were each obstacles for about a third of the local police departments and sheris’ oces that had acquired BWCs. TABLE 8 Public-use footage requests for agencies with body-worn cameras , by agency type , 2016 Average times per month that public requests video footage Total a Local police Sheri ’ s oce Never b 17.7 % 18.0 % 16.2 % 0 c 44.8 44.9 44.6 1–5 20.8 21.1 19.4 6–10 1.7 1.8 1.5 11 or more 1.2 1.3 0.7 Unsure/unknown 10.9 10.2 13.5 Number of agencies with body-worn cameras 7 , 259 5 , 847 1 , 399 Note: Details may not sum to 100% due to missing data. See appendix table 11 for standard errors. a Includes the 13 primary state police agencies that acquired body-worn cameras. These had too few cases to show individual results. b These agencies reported that the public has never requested video generated by BWCs. c These agencies reported an average of zero requests per month. (For example , they may have received only one request per year.) Source: Bureau of Justice Statistics , Law Enforcement Management and Administrative Statistics - Body-Worn Camera Supplement , 2016. TABLE 9 Obstacles encountered with using body-worn cameras or with footage , by agency type , 2016 Type of obstacle Total a Local police Sheri ’ s oce Privacy 34.7 % 36.2 % 28.1 % Video storage procedures 33.8 33.7 34.1 Costs were greater than expected 32.5 32.7 31.4 Technical diculties 21.0 20.6 22.5 Liability 20.7 21.6 16.8 Burden of requests for footage from public/agency 20.2 20.6 18.3 Security of information contained in video 20.0 20.1 19.4 Lack of support b 8.8 8.9 8.2 Other c 11.5 11.4 11.8 Unsure/unknown 19.4 19.1 20.7 Number of agencies with body-worn cameras 7 , 259 5 , 847 1 , 399 Note: See appendix table 12 for standard errors. a Includes the 13 primary state police agencies that acquired body-worn cameras. These had too few cases to show individual results. b Includes lack of support by ocer , public , or ocer labor union/ other organization. c Includes cameras not in use yet , too early to tell , none , and other agency-specied responses. Source: Bureau of Justice Statistics , Law Enforcement Management and Administrative Statistics - Body-Worn Camera Supplement , 2016. BODYWORN CAMERAS IN LAW ENFORCEMENT AGENCIES , 2016 | NOVEMBER 2018 Law enforcement agencies without body-worn cameras In 2016 , more than 8 , 000 general-purpose law enforcement agencies had not acquired body-worn cameras (BWCs) (table 10) . In terms of other recording devices , 62% of these agencies had acquired dashboard cameras and 32% had acquired personal audio recorders. Almost all primary state police agencies without BWCs had dashboard cameras (94%) , whereas 66% of sheris ’ oces and 61

10 % of local police departments without BW
% of local police departments without BWCs had dashboard cameras. About 45% of primary state police agencies , 40% of sheris ’ oces , and 30% local and county police departments without BWCs had personal audio recorders. About three-quarters of law enforcement agencies without BWCs reported video storage and hardware costs as primary reasons for not obtaining them Most general-purpose law enforcement agencies without BWCs cited costs as a reason for not obtaining BWCs (table 11) . Agencies were primarily concerned with costs associated with video storage or disposal (77%) , hardware (74%) , ongoing maintenance or support (73%) , and public records requests or video redaction (68%). About two in ve (39%) law enforcement agencies without BWCs stated they had not acquired BWCs due to privacy concerns. About 41% of local police departments , 32% of sheris ’ oces , and 45% of primary state police agencies were concerned about privacy. Overall , 13% of law enforcement agencies without BWCs stated there was no need for the technology. About 14% of local police departments , 11% of sheris ’ oces , and 36% of primary state police agencies felt there was no need for BWCs. Continued on next page TABLE 10 Alternative methods of recording police-citizen interactions for agencies without body-worn cameras , by agency type , 2016 All agencies Agencies without body-worn cameras Type of agency Total Dashboard cameras Personal audio recorders Other event- recording equipment* Total Dashboard cameras Personal audio recorders Other event- recording equipment* Total 15 , 328 69.0 % 38.1 % 15.4 % 8 , 069 62.1 % 32.3 % 15.8 % Local police 12 , 267 68.0 35.9 15.4 6 , 420 60.8 30.1 16.6 Sheri ’ s oce 3 , 012 72.6 46.8 15.3 1 , 613 66.4 40.4 13.0 Primary state police 49 93.2 49.5 8.8 ! 36 93.5 45.2 6.5 ! Note: See appendix table 13 for standard errors. ! Interpret with caution. Too few cases to provide a reliable rate , or coecient of variation is greater than 50%. *Includes devices for interview rooms , building surveillance , and other agency-specied responses. Source: Bureau of Justice Statistics , Law Enforcement Management and Administrative Statistics - Body-Worn Camera Supplement , 2016. TABLE 11 Reasons for not having acquired body-worn cameras , by agency type , 2016 Reason Total Local police Sheri ’ s oce Primary state police Video storage/disposal costs 76.6 % 76.7 % 76.2 % 71.0 % Hardware costs 74.4 73.3 78.7 64.5 Ongoing maintenance/ support costs 72.8 73.0 72.5 64.5 Public records request/video redaction costs 68.3 69.1 65.1 54.8 Privacy concerns 39.4 41.1 32.3 45.2 Training costs 38.8 38.6 39.6 29.0 ! Video transfer/storage issues 31.6 31.0 33.4 48.4 Liability concerns 25.0 26.1 21.0 19.4 ! Camera operation technical diculties 18.3 18.1 19.2 19.4 ! No perceived need 13.3 13.9 10.8 35.5 Lack of support a 7.2 7.6 5.8 6.5 ! Other b 13.0 13.7 10.4 19.4 ! Number of agencies without body-worn cameras 8 , 069 6 , 420 1 , 613 36 Note: Details do not sum to 100% due to non-mutually excl

11 usive categories. The categories of rea
usive categories. The categories of reasons given were provided as response options on the questionnaire , and agencies were asked to select all that apply. See appendix table 14 for standard errors. ! Interpret with caution. Too few cases to provide a reliable rate , or coecient of variation is greater than 50%. a Includes lack of community , agency leadership , or patrol ocer support. b Includes legislation/legal issues , need for improved technology , best practices unknown , currently acquiring , and other agency-specied responses. Source: Bureau of Justice Statistics , Law Enforcement Management and Administrative Statistics - Body-Worn Camera Supplement , 2016. BODYWORN CAMERAS IN LAW ENFORCEMENT AGENCIES , 2016 | NOVEMBER 2018 About 60% of agencies without BWCs expressed concern about initial acquisition costs In 2016 , about 33% of sheris ’ oces and 31% of local police departments without BWCs said they were likely to consider acquiring BWCs in the next year (not shown). Of these agencies , 48% anticipated acquiring BWCs within 12 months , and about 36% were unsure when they would acquire BWCs. About 19% of primary state police agencies without BWCs said they were likely to consider acquiring BWCs in the next year. Among agencies without BWCs , the top factors determining whether they would explore using BWCs in the next year were costs , concerns about privacy and liability , and public expectations (gure 2) . Initial acquisition and ongoing maintenance costs were each selected by about 60% of agencies as factors that would determine whether they explored BWCs in the next year. About 40% of primary state police agencies reported privacy concerns as a factor. (See appendix table 15 for the full list of factors and their estimates.) About three-quarters (73%) of general-purpose law enforcement agencies without BWCs said ocers would be supportive of adopting BWCs In 2016 , 73% of general-purpose law enforcement agencies without BWCs stated ocers would be very or somewhat supportive of adopting BWCs (appendix table 2). Similarly , 71% of law enforcement agencies thought the community would be very or somewhat supportive of adopting BWCs. More than 80% of the largest (500 or more full-time sworn ocers) local police departments and sheris ’ oces without BWCs said ocers would be very or somewhat supportive of BWC adoption. About 65% of primary state police agencies thought ocers would be supportive of BWC adoption. About 94% of the largest (500 or more full-time sworn ocers) local police departments and 88% of the largest sheris ’ oces felt the community would be supportive. Sixty-eight percent of the smallest local police (0 to 24 full-time sworn ocers) and sheris ’ oces (1 to 24 full-time sworn ocers) said the community would be supportive of adoption. Law enforcement agencies without body-worn cameras (continued) FIGURE 2 Factors determining if an agency would explore body-worn cameras in the next year , by agency type , 2016 No

12 te: See appendix table 15 for estimates
te: See appendix table 15 for estimates and standard errors. ! Interpret with caution. Too few cases to provide a reliable rate , or coecient of variation is greater than 50%. Source: Bureau of Justice Statistics , Law Enforcement Management and Administrative Statistics - Body-Worn Camera Supplement , 2016. !01020304050607080 Public expectationsLiability concernsPrivacy concernsOngoing maintenance costsacquisition costs Percent Factor s oceLocal policePrimary state police BODYWORN CAMERAS IN LAW ENFORCEMENT AGENCIES , 2016 | NOVEMBER 2018 Methodology Survey overview Beginning in 2016, the Law Enforcement Management and Administrative Statistics (LEMAS) adopted a core and supplemental survey structure. e LEMAS core has been conducted every 3 to 4 years since 1987 with approximately 3,200 state, local, and county law enforcement agencies across the United States. Due to the breadth of the survey, detailed analysis of any specic law enforcement topic cannot be done with the LEMAS core. e LEMAS supplements are designed to ll this void by allowing for a more comprehensive examination on a key topic in law enforcement and are administered between core years. e 2016 Body-Worn Camera Supplement (LEMAS-BWCS) is the rst supplement administered under the new structure. Using a similar sampling procedure as the LEMAS core, the 2016 LEMAS-BWCS was administered to a nationally representative sample of approximately 5,000 state, county, and local general-purpose law enforcement agencies. e survey was administered to agencies regardless of whether they had body-worn cameras (BWCs) and contained items for agencies with and without BWCs. e survey examined reasons for acquiring and not acquiring BWCs, types of deployment, policies and procedures surrounding camera use and handling of the resulting video les, any obstacles to camera acquisition and use, levels of support for BWCs, and use of alternative recording equipment. e LEMAS- BWCS data collection period was May-October 2016. RTI International served as BJS’s data collection agent. Sampling procedure e sample for the 2016 LEMAS-BWCS was derived from the 2016 Law Enforcement Agency Roster (LEAR) database. e LEAR was originally built from a variety of sources including, but not limited to, the 2008 and 2014 Census of State and Local Law Enforcement Agencies (CSLLEA) and the 2013 LEMAS Survey. e 2016 LEAR contains a census of 15,810 general-purpose law enforcement agencies, including 12,695 local and county police departments, 3,066 sheris’ oces, and 49 primary state police departments. Local police departments and sheris’ oces were chosen for the 2016 LEMAS-BWCS using a stratied sample design based on the number of full- and part-time sworn ocers (part-time sworn ocers were counted as 0.5 full-time equivalents) and agency type. e sample was designed to be representative of all general-purpose state and local law enforcement agencies in the United States, with separate samples drawn for local police department

13 s and sheris’ oces. All
s and sheris’ oces. All 49 primary state law enforcement agencies (state police and highway patrol) were included, and all have 100 or more full-time sworn ocers. (Hawaii does not have a primary state agency.) Agencies serving special jurisdictions (such as schools, airports, or parks) or with special enforcement responsibilities (such as conservation or alcohol laws) were considered out-of-scope for the LEMAS-BWCS. e original 2016 LEMAS-BWCS sample included 5,063 state, local, and county law enforcement agencies. During the data collection phase, it was determined that 56 agencies did not engage in primary law enforcement activities, 13 had closed, 7 had one part-time sworn ocer (a minimum of the equivalent of one full-time sworn ocer was required for potential inclusion), 3 were temporarily without sworn sta, 7 were part of another agency or contracted services, and 1 was a duplicate agency. e nal sample size was 4,976 and included 1,048 self-representing (SR) agencies with 100 or more sworn personnel and 3,928 nonself-representing (NSR) agencies employing fewer than 100 sworn. e SR agencies included 640 local and county police departments, 359 sheris’ oces, and 49 state law enforcement agencies. e NSR local police agencies and NSR sheris’ oces were selected using a stratied random sample based on the number of sworn personnel and agency type. e total NSR local police sample included 3,067 agencies, and the NSR sheris’ oces sample included 861 agencies. Agency response rate Of the 4,976 eligible agencies that received the 2016 LEMAS-BWCS, 3,928 agencies completed the survey, for a response rate of 79% (table 12) . By size, the response rate for local police departments ranged from 92% for SR agencies to 61% for agencies with one ocer. For sheris’ oces, the response rate ranged from 83% for SR agencies to 50% for agencies with one ocer. e response rate for primary state police agencies was approximately 90%. Because the overall response rate was less than 80%, a non-response bias analysis was conducted. Eect sizes were calculated across agency type only, size only, size and type combined, and census region. Frame data were used for both respondents and non-respondents. e BODYWORN CAMERAS IN LAW ENFORCEMENT AGENCIES , 2016 | NOVEMBER 2018 eect size compares sample members to respondents to detect if there is large deviation. Generally, eect sizes of less than 0.2 are considered small and do not indicate concern for non-response bias. All four eect sizes were smaller than 0.2, with the combination of size and type having the largest calculated eect size of 0.1. An adjustment factor unique to each stratum was used to account for non-response and ineligible agencies. ese non-response adjustments and the nal resulting analytical weights are included in table 13. Five primary state police agencies did not complete the LEMAS-BWCS. Two of these agencies submitted an incomplete LEMAS-BWCS questio

14 nnaire but conrmed they had not ac
nnaire but conrmed they had not acquired BWCs. e other three agencies that did not submit a LEMAS-BWCS completed the 2016 LEMAS core survey and indicated that they had no BWCs. erefore, the 13 state agencies that reported having BWCs comprise all state police agencies with BWCs and did not require a non-response adjustment. e non-response adjustment was calculated for state police agencies without BWCs, and a nal weight of 1.161 was applied to items that were asked only of agencies without BWCs. Item non-response and imputation Data were primarily collected through two dierent modes. Agencies had the choice to respond via web or mail in a paper survey. Additional data were captured through phone interviews for an abbreviated set of questions. Among the responding agencies, 86% completed via web, 12% via mail, and 2% by combination of web and phone. For the 3,928 agencies completing the survey, overall item non-response rates due to omission or invalid data were less than 2% for the data elements used in this report, except for acquisition of dashboard cameras (3.9% missing), personal audio recorders (8.2%), and other recording equipment (16.8%). Missing data for a particular item were not removed from the denominator for analyses. Imputation was used on only the number of full-time sworn ocers. Cold-deck imputation was implemented using the value from the LEAR frame. Minor editing was completed for BWC acquisition based on subsequent questions (i.e., an agency marked that it had not acquired BWCs but answered the questions on acquisition, conrming it had). TABLE 13 Base weights , non-response adjustment factors , and nal analytical weights , by agency type and size , 2016 Type of agency and size Base sample weight Non-response adjustment* Final analytical weight Local police 100 or more 1.000 1.087 1.087 50–99 3.756 1.194 4.486 25–49 3.745 1.167 4.371 10–24 3.746 1.233 4.618 5–9 3.748 1.370 5.135 2–4 3.748 1.411 5.286 1 3.756 1.774 6.661 Sheri ’ s oce 100 or more 1.000 1.201 1.201 50–99 3.076 1.297 3.989 25–49 3.068 1.278 3.919 10–24 3.052 1.397 4.265 5–9 3.040 1.381 4.198 2–4 3.085 1.479 4.562 1 2.889 2.163 6.250 Primary state police Body-worn cameras 1.000 1.000 1.000 No body-worn cameras 1.000 1.161 1.161 Note: Includes both full- and part-time ocers , with a weight of 0.5 assigned to part-time ocers. *Includes adjustment based on agency eligibility from the 2016 Law Enforcement Management and Administrative Statistics survey. Source: Bureau of Justice Statistics , Law Enforcement Management and Administrative Statistics - Body-Worn Camera Supplement , 2016. TABLE 12 Response rate , by agency type and size , 2016 Type and size of agency Response rate Total 78.9 % Local police 79.6 % 100 or more 91.7 50–99 84.4 25–49 85.9 10–24 81.4 5–9 73.0 2–4 72.6 1 60.8 Sheri ’ s oce 76.6 % 100 or more 83.0 50–99 77.1 25–49 79.3 10–24 71.8 5–9 72.8 2–4 69.6 1 50.0 Primary state police 89.8 % Note: Includ

15 es both full- and part-time ocers ,
es both full- and part-time ocers , with a weight of 0.5 assigned to part-time ocers. Source: Bureau of Justice Statistics , Law Enforcement Management and Administrative Statistics - Body-Worn Camera Supplement , 2016. BODYWORN CAMERAS IN LAW ENFORCEMENT AGENCIES , 2016 | NOVEMBER 2018 Accuracy of the estimates e accuracy of the estimates presented in this report depends on two types of error: sampling and non-sampling. Sampling error is the variation that may occur by chance because a sample was used rather than a complete enumeration of the population. Non-sampling error can be attributed to many sources, such as the inability to obtain information about all cases in the sample, the inability to obtain complete and correct information from the administrative records, and processing errors. In any survey, the full extent of the non-sampling error is dicult to measure. As measured by an estimated standard error, the sampling error varies by the size of the estimate and base population. Because BWC data were collected from a sample, the results are subject to sampling error. Variance and standard error estimates for the 2016 LEMAS-BWCS were generated using the IBM SPSS statistical soware package. e Taylor linearization method for a “stratied without replacement” design was used for these calculations. See appendix tables 1 through 15 for the standard error estimates. ese standard error estimates may be used to construct condence intervals around percentages in this report. For example, the 95% condence interval around the percentage of departments that have acquired BWCs is 47% ± (1.96 × 0.8%), or approximately 45% to 49%. Standard error estimates may also be used to construct condence intervals around numeric variables such as number of full-time sworn personnel in agencies with BWCs. For example, the 95% condence interval around the number of full-time sworn personnel in agencies with BWCs is approximately 414,504 ± (1.96 × 30,587) or 354,553 to 474,455. BODYWORN CAMERAS IN LAW ENFORCEMENT AGENCIES , 2016 | NOVEMBER 2018 PPENDIX TABLE 1 Reasons why body-worn cameras have not been fully deployed , by agency type , 2016 Estimate Standard error Reason Total a Local police Sheri ’ s oce Total Local police Sheri ’ s oce Insucient funding 63.3 % 60.9 % 71.3 % 1.7 % 2.1 % 3.0 % Technology challenges 50.0 49.6 51.3 1.8 2.1 3.4 Lack of sta to handle footage 29.6 30.2 27.4 1.6 2.0 2.9 Legal/policy issues 25.3 27.8 17.4 1.6 1.9 2.5 Currently vetting vendor oerings 16.1 16.3 15.2 1.2 1.4 2.3 Benets unclear 12.2 12.2 11.9 1.2 1.4 2.2 Insucient time to complete deployment 11.9 12.4 10.5 1.2 1.4 2.0 Lack of support b 7.0 7.5 5.2 1.0 1.2 1.6 Other c 7.4 7.3 7.5 0.9 1.1 1.8 Number of agencies 2 , 876 2 , 196 670 82 75 33 a Includes the 13 primary state police agencies that acquired body-worn cameras. These had too few cases to show individual results. b Includes lack of community , agency leadership , or patrol ocer support. c Includes waiting on

16 legislation , currently acquiring , a
legislation , currently acquiring , and other agency-specied responses. Source: Bureau of Justice Statistics , Law Enforcement Management and Administrative Statistics - Body-Worn Camera Supplement , 2016. PPENDIX TABLE 2 Ocer and community support of body-worn cameras , by agency type and size , 2016 Number of agencies without body-worn cameras Estimate Standard error Type and size of agency Ocers would be very or somewhat supportive Community would be very or somewhat supportive Ocers would be very or somewhat supportive Community would be very or somewhat supportive Total 8 , 069 73.3 % 70.5 % 1.0 % 1.0 % Local police 6 , 420 73.3 % 70.4 % 1.1 % 1.2 % 500 or more 20 83.3 94.4 7.0 4.3 100–499 244 72.4 82.6 2.5 2.1 25–99 1 , 428 73.0 77.0 2.3 2.2 0–24* 4 , 728 73.4 67.7 1.4 1.5 Sheri ’ s oce 1 , 613 73.3 % 71.1 % 2.0 % 2.1 % 500 or more 19 81.3 87.5 7.5 6.3 100–499 162 79.0 79.0 3.3 3.3 25–99 506 75.2 72.9 3.6 3.7 1–24 926 71.2 68.3 2.9 2.9 Primary state police 36 64.5 % 71.0 % 5.3 % 5.0 % *Includes agencies with only part-time sworn personnel. Source: Bureau of Justice Statistics , Law Enforcement Management and Administrative Statistics - Body-Worn Camera Supplement , 2016. BODYWORN CAMERAS IN LAW ENFORCEMENT AGENCIES , 2016 | NOVEMBER 2018 PPENDIX TABLE 3 Estimates and standard errors for gure 1: General-purpose law enforcement agencies with recording devices , by type of device , 2016 Type of device Estimate Standard error Any type of recording device 83.3 % 0.6 % Dashboard cameras 69.0 0.7 Body-worn cameras 47.4 0.8 Personal audio recorders 38.1 0.7 Other* 15.4 0.5 *Includes devices for interview rooms , building surveillance , and other agency-specied responses. Source: Bureau of Justice Statistics , Law Enforcement Management and Administrative Statistics - Body-Worn Camera Supplement , 2016. PPENDIX TABLE 4 Standard errors for table 1: Agencies that had acquired and started using body-worn cameras , by agency type and size , 2016 Type and size of agency Acquired BWCs At least some BWCs in service Total 0.8 % 0.8 % Local police 0.9 % 0.9 % 1 , 000 or more 1.8 1.8 500–999 1.6 1.9 250–499 1.4 1.5 100–249 1.4 1.4 50–99 3.2 3.1 25–49 2.3 2.2 10–24 1.8 1.8 5–9 2.0 2.0 1–4 1.8 1.8 0 6.2 6.2 Sheri ’ s oce 1.5 % 1.5 % 1 , 000 or more 5.0 5.2 500–999 4.3 4.3 250–499 2.8 2.9 100–249 2.7 2.6 50–99 4.4 4.4 25–49 3.4 3.4 10–24 3.0 3.0 5–9 3.8 3.8 1–4 6.2 6.2 Primary state police 2.1 % 2.1 % Source: Bureau of Justice Statistics , Law Enforcement Management and Administrative Statistics - Body-Worn Camera Supplement , 2016. BODYWORN CAMERAS IN LAW ENFORCEMENT AGENCIES , 2016 | NOVEMBER 2018 PPENDIX TABLE 5 Standard errors for table 2: Full-time sworn ocers with body-worn cameras , by agency type , 2016 Type of agency Number of full-time sworn ocers in agencies with BWCs BWCs in service BWCs to be deployed within the next 12 months Number BWCs per 100 full-time sworn ocers Number BWCs per 10

17 0 full-time sworn ocers Overall
0 full-time sworn ocers Overall 30 , 587 3 , 325 2.1 5 , 887 1.6 Local police 29 , 674 2 , 881 2.9 5 , 492 2.1 Sheri ' s oce 6 , 831 1 , 598 2.3 1 , 852 1.6 Source: Bureau of Justice Statistics , Law Enforcement Management and Administrative Statistics Body Worn Camera Supplement , 2016. PPENDIX TABLE 6 Standard errors for table 3: Reasons why body-worn cameras were acquired , by agency type and size , 2016 Reason Agencies with BWCs Local police Sheri ’ s oce Total 500 or more 100–499 25–99 0–24 Total 500 or more 100–499 25–99 1–24 Improve ocer safety 0.9 % 1.0 % 3.5 % 2.2 % 2.6 % 1.2 % 1.9 % 7.3 % 3.6 % 3.5 % 2.7 % Reduce/resolve civilian complaints 0.9 1.0 3.1 2.0 2.1 1.3 2.0 7.3 3.3 3.4 3.0 Improve evidence quality 1.0 1.1 3.7 2.4 2.7 1.3 1.8 7.3 3.6 3.5 2.5 Reduce agency liability 1.0 1.1 3.5 2.0 2.6 1.3 2.1 7.9 3.7 3.9 3.0 Improve ocer/agency accountability 1.0 1.2 3.1 1.6 2.7 1.5 2.1 6.9 3.5 3.7 3.2 Make cases more prosecutable 1.1 1.2 3.9 2.5 3.0 1.5 2.1 8.1 4.1 3.9 2.8 Improve ocer professionalism 1.2 1.3 3.7 2.2 3.0 1.6 2.4 7.6 4.1 4.2 3.5 Improve community perceptions 1.2 1.3 3.4 2.0 2.9 1.6 2.4 7.6 4.0 4.1 3.4 Simplify incident review 1.2 1.3 3.9 2.3 3.1 1.6 2.4 6.9 3.8 4.2 3.5 Improve training 1.2 1.3 3.9 2.3 3.1 1.6 2.4 8.2 4.1 4.2 3.5 Reduce use of force 1.1 1.3 3.8 2.5 3.0 1.5 2.3 8.2 4.2 4.1 3.3 Strengthen police leadership 1.0 1.2 3.4 1.7 2.7 1.4 2.0 6.3 3.2 3.7 3.0 Pilot testing only 0.9 1.0 3.9 2.4 2.6 1.1 1.7 8.1 3.7 3.5 2.2 Other 0.8 1.0 3.5 1.9 2.4 1.1 1.7 5.6 3.2 3.0 2.5 Source: Bureau of Justice Statistics , Law Enforcement Management and Administrative Statistics - Body-Worn Camera Supplement , 2016. PPENDIX TABLE 7 Standard errors for table 4: Deployment of body-worn cameras among agencies that had acquired BWCs , by agency type and size , 2016 Type and size of agency Full Partial Exploratory/ pilot Unsure/ don ’ t know Total 1.1 % 0.9 % 0.9 % 0.4 % Local police 1.3 % 1.0 % 1.0 % 0.5 % 500 or more 2.6 3.9 3.9 1.3 100–499 2.5 2.2 2.3 0.5 25–99 3.1 2.5 2.7 0.8 0–24 1.6 1.2 1.1 0.6 Sheri ’ s oce 2.4 % 2.1 % 1.9 % 0.9 % 500 or more 6.3 7.9 8.2 0.0 100–499 3.4 4.0 3.8 2.4 25–99 4.2 4.1 3.4 1.7 1–24 3.5 2.8 2.6 1.2 Source: Bureau of Justice Statistics , Law Enforcement Management and Administrative Statistics - Body-Worn Camera Supplement , 2016. BODYWORN CAMERAS IN LAW ENFORCEMENT AGENCIES , 2016 | NOVEMBER 2018 PPENDIX TABLE 8 Standard errors for table 5: Policy topics related to body-worn cameras , by agency type and size , 2016 Among of agencies with a BWC policy , percent that covered— Type and size of agency Percent with BWC policy Video transfer , storage , or disposal Specic events to record Video upload/ooad frequency Routine supervisor review of footage Ocer review of footage Public release of raw (unredacted) footage Informing citizens they are being recorded Content that must be redacted Total 0.8 % 0.9 % 0.9 % 1.0 % 1.1 % 1.2 % 1.3 % 1.3 % 1.3 % Local police 0.9 % 1.0 % 1.1

18 % 1.1 % 1.2 % 1.4 % 1.4 % 1.4 % 1.4 % 5
% 1.1 % 1.2 % 1.4 % 1.4 % 1.4 % 1.4 % 500 or more 1.3 2.1 1.4 2.8 2.8 2.3 3.9 3.8 4.0 100–499 0.8 0.8 0.9 1.3 1.4 1.6 2.6 2.3 2.6 25–99 1.7 1.5 1.7 1.8 2.3 2.5 3.2 3.2 3.3 0–24 1.2 1.3 1.4 1.5 1.5 1.7 1.8 1.8 1.7 Sheri ’ s oce 1.8 % 1.9 % 2.1 % 2.3 % 2.5 % 2.6 % 2.7 % 2.5 % 2.6 % 500 or more 3.4 5.1 3.7 5.1 5.1 7.4 8.7 7.8 8.2 100–499 2.9 2.9 3.9 3.3 3.4 4.2 4.5 4.3 4.4 25–99 2.8 3.1 3.5 3.9 4.3 4.5 4.6 4.4 4.2 1–24 2.8 3.1 3.2 3.5 3.7 4.0 4.1 3.8 3.9 Source: Bureau of Justice Statistics , Law Enforcement Management and Administrative Statistics - Body-Worn Camera Supplement , 2016. PPENDIX TABLE 9 Standard errors for table 6: Events that body-worn cameras are required to record , by agency type , 2016 Total Local police Sheri ’ s oce Type of event Trac stops 0.7 % 0.8 % 1.6 % Ocer-initiated citizen contacts 1.0 1.1 2.2 Executing arrest/search warrants 1.0 1.1 2.0 Firearms deployments 1.0 1.1 2.4 Responding to routine service calls 1.1 1.3 2.5 Criminal investigations 1.2 1.4 2.7 Public-order policing 1.4 1.6 3.0 Special operations 1.4 1.6 3.0 Transporting oenders 1.4 1.6 2.9 Policing public events 1.2 1.4 2.6 Other 0.8 0.9 1.8 Source: Bureau of Justice Statistics , Law Enforcement Management and Administrative Statistics - Body-Worn Camera Supplement , 2016. BODYWORN CAMERAS IN LAW ENFORCEMENT AGENCIES , 2016 | NOVEMBER 2018 PPENDIX TABLE 10 Standard errors for table 7: Personnel with direct access to video produced by body-worn cameras , by agency type and size , 2016 In agencies with BWCs in service , personnel with direct access to video Type and size of agency Chief executive Executive sta Ocer that made recording Supervisor of ocer that made recording Internal aairs Head of information technology District attorney ’ s oce Other employed sworn ocers Other information technology sta Other non-sworn employees Other Total 0.8 % 1.1 % 1.2 % 1.2 % 1.0 % 0.9 % 1.0 % 0.9 % 0.7 % 0.6 % 0.4 % Local police 0.8 % 1.2 % 1.4 % 1.3 % 1.1 % 1.0 % 1.1 % 1.1 % 0.8 % 0.7 % 0.5 % 500 or more 3.1 3.2 3.1 3.2 2.6 4.1 4.3 4.2 4.4 3.7 3.5 100–499 1.5 1.6 2.1 2.4 2.3 2.6 2.0 2.3 2.2 2.4 1.3 25–99 1.8 1.9 3.1 2.7 2.9 3.1 2.4 2.4 2.6 2.2 1.3 0–24 1.0 1.5 1.6 1.6 1.3 1.1 1.3 1.3 0.8 0.8 0.6 Sheri ’ s oce 1.9 % 2.3 % 2.5 % 2.5 % 2.2 % 2.2 % 2.2 % 2.0 % 1.6 % 1.3 % 0.8 % 500 or more 7.7 7.7 7.1 7.1 7.7 8.7 8.2 7.7 8.9 5.3 3.9 100–499 4.3 3.6 4.4 4.3 4.0 4.4 3.0 2.5 3.4 2.3 2.0 25–99 3.5 3.7 4.3 4.3 4.5 4.5 3.8 3.6 3.3 2.4 1.9 1–24 2.7 3.5 3.6 3.6 2.8 2.8 3.3 2.9 1.9 1.8 0.8 Source: Bureau of Justice Statistics , Law Enforcement Management and Administrative Statistics - Body-Worn Camera Supplement , 2016. PPENDIX TABLE 11 Standard errors for table 8: Public-use footage requests for agencies with body-worn cameras , by agency type , 2016 Average times per month that public requests video footage Total Local police Sheri ’ s oce Never 0.9 % 1.0 % 1.8 % 0 1.1 1.3 2.3 1–5 0.9 1.0 1.9 6–10 0.3 0.3 0.6 11 or more 0.2

19 0.2 0.4 Unsure/unknown 0.7 0.7 1.5 Sour
0.2 0.4 Unsure/unknown 0.7 0.7 1.5 Source: Bureau of Justice Statistics , Law Enforcement Management and Administrative Statistics - Body-Worn Camera Supplement , 2016. PPENDIX TABLE 12 Standard errors for table 9: Obstacles encountered with using body-worn cameras or with footage , by agency type , 2016 Total Local police Sheri ’ s oce Type of obstacle Privacy 1.1 % 1.2 % 2.1 % Video storage procedures 1.1 1.2 2.3 Costs were greater than expected 1.1 1.3 2.2 Technical diculties 1.0 1.1 2.1 Liability 1.0 1.1 1.8 Burden of requests for footage from public/agency 0.9 1.0 1.8 Security of information contained in video 0.9 1.1 1.9 Lack of support 0.7 0.7 1.3 Other 0.8 0.9 1.6 Unsure/unknown 0.9 1.1 2.0 Source: Bureau of Justice Statistics , Law Enforcement Management and Administrative Statistics - Body-Worn Camera Supplement , 2016. BODYWORN CAMERAS IN LAW ENFORCEMENT AGENCIES , 2016 | NOVEMBER 2018 PPENDIX TABLE 13 Standard errors for table 10: Alternative methods of recording police-citizen interactions for agencies without body-worn cameras , by agency type , 2016 All agencies Agencies without body-worn cameras Type of agency Dashboard cameras Personal audio recorders Other event- recording equipment Dashboard cameras Personal audio recorders Other event- recording equipment Total 0.7 % 0.7 % 0.5 % 1.1 % 1.0 % 0.8 % Local police 0.8 0.8 0.6 1.2 1.2 0.9 Sheri ’ s oce 1.4 1.5 1.1 2.2 2.2 1.5 Primary state police 1.2 2.4 1.4 2.7 5.5 2.7 Source: Bureau of Justice Statistics , Law Enforcement Management and Administrative Statistics - Body-Worn Camera Supplement , 2016. PPENDIX TABLE 14 Standard errors for table 11: Reasons for not having acquired body-worn cameras , by agency type , 2016 Reason Total Local police Sheri ’ s oce Primary state police Video storage/disposal costs 1.0 % 1.1 % 1.9 % 5.0 % Hardware costs 1.0 1.1 1.8 5.3 Ongoing maintenance/support costs 1.0 1.2 2.0 5.3 Public records request/video redaction costs 1.0 1.2 2.2 5.5 Privacy concerns 1.1 1.2 2.1 5.5 Training costs 1.1 1.3 2.2 5.0 Video transfer/storage issues 1.0 1.2 2.1 5.5 Liability concerns 1.0 1.1 1.8 4.4 Camera operation technical diculties 0.9 1.0 1.8 4.4 No perceived need 0.8 0.9 1.4 5.3 Lack of support 0.6 0.7 1.1 2.7 Other 0.7 0.9 1.3 4.4 Source: Bureau of Justice Statistics , Law Enforcement Management and Administrative Statistics - Body-Worn Camera Supplement , 2016. PPENDIX TABLE 15 Estimates and standard errors for gure 2: Factors determining if an agency would explore body-worn cameras in the next year , by agency type , 2016 Estimate Standard error Factor Total Local police Sheri ’ s oce Primary state police Total Local police Sheri ’ s oce Primary state police Initial acquisition costs 63.7 % 62.4 % 68.6 % 64.5 % 1.1 % 1.2 % 2.1 % 5.3 % Ongoing maintenance costs 58.9 59.2 57.5 61.3 1.1 1.3 2.2 5.4 Privacy concerns 33.7 34.7 29.4 41.9 1.0 1.2 2.0 5.5 Liability concerns 29.0 30.3 23.9 25.8 ! 1.0 1.2 1.9 4.8 Public expectations 20.5 21.8 14.8 38.7 0.9 1.0 1.6 5.4 Leadership directives 14.6 15

20 .1 11.8 45.2 0.8 0.9 1.3 5.5 Other simil
.1 11.8 45.2 0.8 0.9 1.3 5.5 Other similar/nearby jurisdictions acquiring body-worn cameras 10.5 11.8 5.6 3.2 ! 0.7 0.8 1.0 2.0 Support from patrol ocers 9.4 9.9 7.7 9.7 ! 0.7 0.8 1.2 3.3 Support from agency leadership 7.8 7.9 7.1 19.4 ! 0.6 0.7 1.1 4.4 Communication/relationship with vendors 5.6 5.5 5.5 19.4 ! 0.5 0.6 1.0 4.4 Other* 14.2 15.1 10.1 25.8 ! 0.8 0.9 1.3 4.8 Note: Factor categories were response options on the questionnaire , and agencies were asked to select all that apply. ! Interpret with caution. Estimate based on fewer than 10 cases , or coecient of variation is greater than 50%. *Other includes legislation , support from government ocials , and other agency-specied responses. Source: Bureau of Justice Statistics , Law Enforcement Management and Administrative Statistics - Body-Worn Camera Supplement , 2016. Oce of Justice Programs Building Solutions • Supporting Communities • Advancing Justice www.ojp.gov e Bureau of Justice Statistics of the U.S. Department of Justice is the principal federal agency responsible for measuring crime, criminal victimization, criminal oenders, victims of crime, correlates of crime, and the operation of criminal and civil justice systems at the federal, state, tribal, and local levels. BJS collects, analyzes, and disseminates reliable statistics on crime and justice systems in the United States, supports improvements to state and local criminal justice information systems, and participates with national and international organizations to develop and recommend national standards for justice statistics. Jerey H. Anderson is the director. is report was written by Shelley Hyland. Connor Brooks veried the report. Caitlin Scoville and Jill omas edited the report. Tina Dorsey produced the report. November 2018, NCJ 251775 November 2018 NCJ 251775Body-Worn Cameras in Law Enforcement Agencies, 2016Shelley S. Hyland Ph.D. HIGHLIGHTS In 2016 47% of general-purpose lawenforcement agencies in the United States had The main reasons (about 80% each) thatlocal police and sheris oces had acquiredBWCs were to improve ocer safety increaseevidence quality reduce civilian complaints and reduce agency liability. Among agencies that had acquired BWCs 60% of local police departments and 49% ofsheris oces had fully deployed their BWCs. About 86% of general-purpose lawenforcement agencies that had acquired BWCshad a formal BWC policy. About 60% of law enforcement agenciesallowed the ocer who made the recording tohave direct access to the footage. Among agencies that had not acquiredBWCs the primary reason given was costs including video storage/disposal costs hardware costs (74%)maintenance/support costs (73%). FIGURE 1General-purpose law enforcement agencies with recording devices 020406080100 OtherPersonal audiorecordersBody-worncamerasDashboardcamerasAny type of device PercentType of device I n 2016, nearly half (47%) of the 15,328 general-purpose law enforcement agencies in the United States had acquired body-worn cameras (BWCs) (gure 1) Bureau of Justice Statistics Bulleti