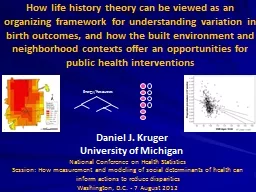
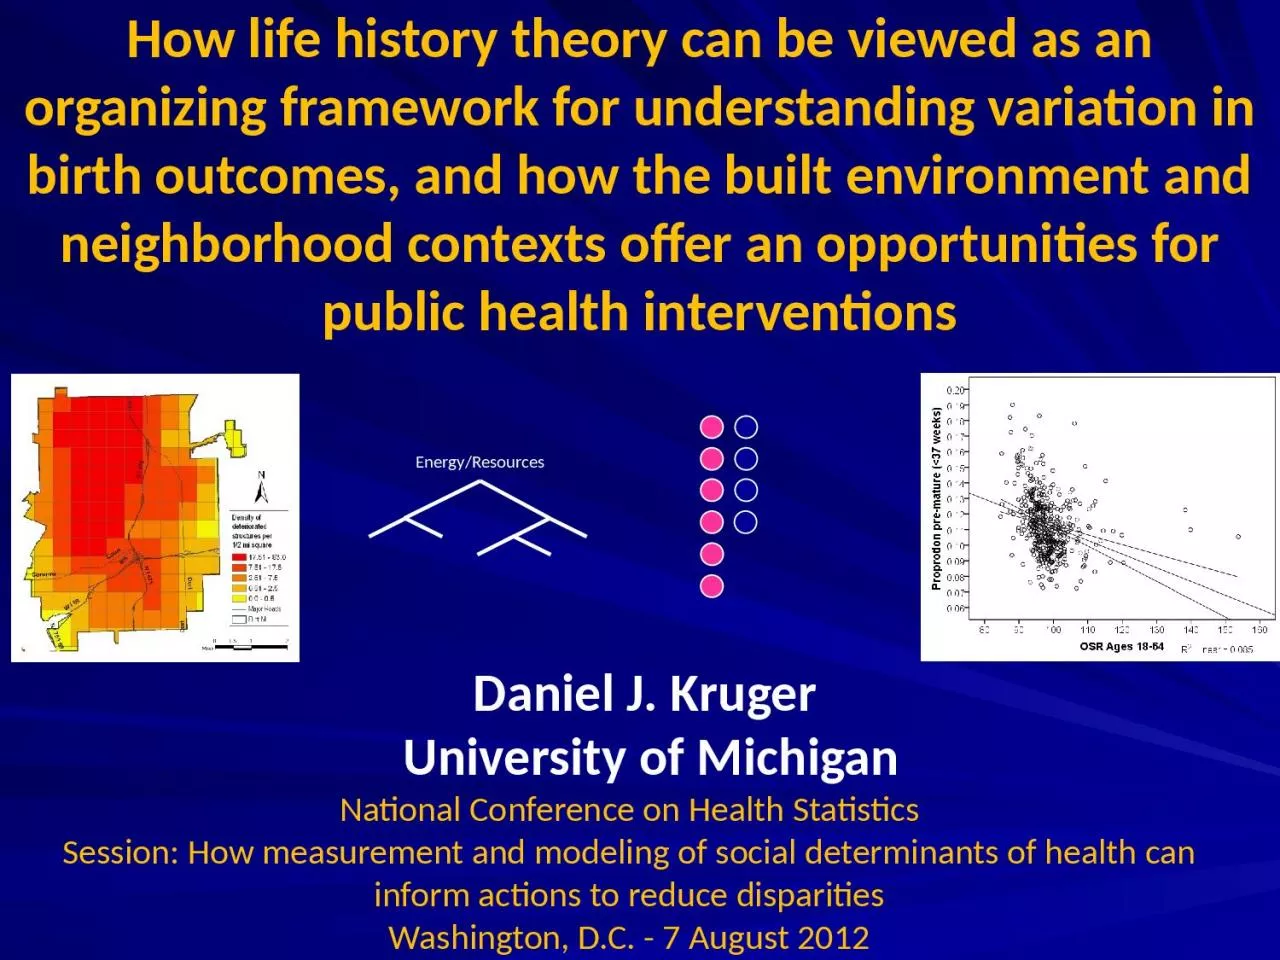
/
How life history theory can be viewed as an organizing framework for understanding variation How life history theory can be viewed as an organizing framework for understanding variation

How life history theory can be viewed as an organizing framework for understanding variation - PowerPoint Presentation

brianna
brianna . @brianna
Follow
0 views
Uploaded On 2024-03-13

How life history theory can be viewed as an organizing framework for understanding variation - PPT Presentation

National Conference on Health Statistics Session How measurement and modeling of social determinants of health can inform actions to reduce disparities Washington DC 7 August 2012 Daniel J Kruger ID: 1047516

investment birth sex paternal birth investment paternal sex higher outcomes ratio amp male rates commitment women part iioperational history

Share:

Link:

Embed:

Download Presentation from below link

Download Presentation The PPT/PDF document "How life history theory can be viewed as..." is the property of its rightful owner. Permission is granted to download and print the materials on this web site for personal, non-commercial use only, and to display it on your personal computer provided you do not modify the materials and that you retain all copyright notices contained in the materials. By downloading content from our website, you accept the terms of this agreement.


Presentation Transcript

1. How life history theory can be viewed as an organizing framework for understanding variation in birth outcomes, and how the built environment and neighborhood contexts offer an opportunities for public health interventionsNational Conference on Health StatisticsSession: How measurement and modeling of social determinants of health can inform actions to reduce disparitiesWashington, D.C. - 7 August 2012Daniel J. Kruger University of MichiganEnergy/Resources

2. Building a healthy babyNational Conference on Health StatisticsSession: How measurement and modeling of social determinants of health can inform actions to reduce disparitiesWashington, D.C. - 7 August 2012Daniel J. Kruger University of MichiganEnergy/Resources

3. African American Infant Mortality TrendsGenesee County MichiganThe Genesee County, Michigan REACH US project is a U.S. Centers for Disease Control and Prevention funded program to reduce the African American health disparity in infant mortality. Coalition partners include the local public health infrastructure, academics, and community-based organizations.

4. 6 Local, State & National Policy5 Providers/Health Care System4 Social Environment3 Social Network2 Family1IndividualSocio-Ecological Model

5. Socio-Ecological Model

6. Socio-Ecological Model+

7.

8. Life History Theory

9. Life History TheoryIntegrates evolutionary, ecological, and socio-developmental perspectives.

10. Life History TheoryIntegrates evolutionary, ecological, and socio-developmental perspectives.Examines how organisms allocate effort over their lifetimes to maximize fitness (contributions to future generations).

11. Life History TheoryIntegrates evolutionary, ecological, and socio-developmental perspectives.Examines how organisms allocate effort over their lifetimes to maximize fitness (contributions to future generations).Illustrates how investment trade-offs are shaped by the environment

12. Life History TheoryEnergy/ResourcesIntegrates evolutionary, ecological, and socio-developmental perspectives.Examines how organisms allocate effort over their lifetimes to maximize fitness (contributions to future generations).Illustrates how investment trade-offs are shaped by the environment

13. Life History TheoryEnergy/ResourcesSomatic effortReproductive effortIntegrates evolutionary, ecological, and socio-developmental perspectives.Examines how organisms allocate effort over their lifetimes to maximize fitness (contributions to future generations).Illustrates how investment trade-offs are shaped by the environment

14. Life History TheoryEnergy/ResourcesSomatic effortReproductive effortMaintenanceGrowthIntegrates evolutionary, ecological, and socio-developmental perspectives.Examines how organisms allocate effort over their lifetimes to maximize fitness (contributions to future generations).Illustrates how investment trade-offs are shaped by the environment

15. Life History TheoryEnergy/ResourcesSomatic effortReproductive effortMaintenanceGrowthParentingMatingIntegrates evolutionary, ecological, and socio-developmental perspectives.Examines how organisms allocate effort over their lifetimes to maximize fitness (contributions to future generations).Illustrates how investment trade-offs are shaped by the environment

16. Life History TheoryEnergy/ResourcesSomatic effortReproductive effortMaintenanceGrowthParentingMatingFutureoffspringCurrentoffspringIntegrates evolutionary, ecological, and socio-developmental perspectives.Examines how organisms allocate effort over their lifetimes to maximize fitness (contributions to future generations).Illustrates how investment trade-offs are shaped by the environment

17. Life History Theory

18. Life History TheoryLHT can be a framework for understanding variation in human birth outcomes as the product of evolved facultative adaptations interacting with modern socio-environmental conditions.

19. Life History TheoryLHT can be a framework for understanding variation in human birth outcomes as the product of evolved facultative adaptations interacting with modern socio-environmental conditions.Anthropologists have used LHT to predict birth outcomes in foraging populations .

20. Life History TheoryLHT can be a framework for understanding variation in human birth outcomes as the product of evolved facultative adaptations interacting with modern socio-environmental conditions.Anthropologists have used LHT to predict birth outcomes in foraging populations .The co-varying factors of prematurity and low birth weight are the primary cause of neonatal mortality in developed countries.

21. Life History TheoryLHT can be a framework for understanding variation in human birth outcomes as the product of evolved facultative adaptations interacting with modern socio-environmental conditions.Anthropologists have used LHT to predict birth outcomes in foraging populations .The co-varying factors of prematurity and low birth weight are the primary cause of neonatal mortality in developed countries.Mechanisms that regulate maternal somatic investment (gestational length, weight at birth) may contribute to adverse birth outcomes.

22. Life History TheoryLHT can be a framework for understanding variation in human birth outcomes as the product of evolved facultative adaptations interacting with modern socio-environmental conditions.Anthropologists have used LHT to predict birth outcomes in foraging populations .The co-varying factors of prematurity and low birth weight are the primary cause of neonatal mortality in developed countries.Mechanisms that regulate maternal somatic investment (gestational length, weight at birth) may contribute to adverse birth outcomes.Conditions suggesting high infant/child mortality risk may shift investment from current offspring to potential future offspring to increase the chance that at least some offspring will survive and reproduce.

23. Candidate risk factor:Deterioration of the built environment

24. Candidate risk factor:Deterioration of the built environmentSince the 1920s, the ‘‘Chicago School’’ in Sociology emphasized the impact of neighborhood physical decay on mental health problems.

25. Candidate risk factor:Deterioration of the built environmentSince the 1920s, the ‘‘Chicago School’’ in Sociology emphasized the impact of neighborhood physical decay on mental health problems. The physical deterioration of the human built environment is increasingly recognized as an important influence on health.

26. Candidate risk factor:Deterioration of the built environmentSince the 1920s, the ‘‘Chicago School’’ in Sociology emphasized the impact of neighborhood physical decay on mental health problems. The physical deterioration of the human built environment is increasingly recognized as an important influence on health.Highly deteriorated neighborhoods increase fear of crime and decrease perceptions of personal safely.

27. Candidate risk factor:Deterioration of the built environmentSince the 1920s, the ‘‘Chicago School’’ in Sociology emphasized the impact of neighborhood physical decay on mental health problems. The physical deterioration of the human built environment is increasingly recognized as an important influence on health.Highly deteriorated neighborhoods increase fear of crime and decrease perceptions of personal safely.This could reduce maternal somatic investment , as it reflects dangerous conditions for the current offspring.

28. Hypothesis

29. HypothesisNeighborhood structural deterioration will be inversely associated with maternal somatic investment

30. HypothesisNeighborhood structural deterioration will be inversely associated with maternal somatic investment Predictions: The density of very deteriorated neighborhood structures will be directly related to the densities of premature and low birth weight births.

31. HypothesisNeighborhood structural deterioration will be inversely associated with maternal somatic investment Predictions: The density of very deteriorated neighborhood structures will be directly related to the densities of premature and low birth weight births.Method: We tested these predictions for births in Flint, Michigan in 2006 with geographically identified birth recordsfrom the Michigan Department of Community Health provided. The Flint Environmental Block Assessment project provided systematic data on the condition of 60,000 neighborhood structures.

32. Genesee County, Michigan

33. Flint, Michigan

34. Flint, Michigan Home of General Motors Corporation, the largest employer.

35. Flint, Michigan Home of General Motors Corporation, the largest employer.82K GM workers in 1970; 16K in 2006.

36. Flint, Michigan Home of General Motors Corporation, the largest employer.82K GM workers in 1970; 16K in 2006.Flint’s population declined 36.5% from 197K in 1970 to 125K in 2000.

37. Flint, Michigan Home of General Motors Corporation, the largest employer.82K GM workers in 1970; 16K in 2006.Flint’s population declined 36.5% from 197K in 1970 to 125K in 2000.Many vacant and dilapidated properties, especially near the former car factories.

38. MethodWe used Geographical Information Systems to calculate the proportional density of outcomes in .25 mi2 areas:Highly deteriorated residential structuresPre-mature (<37 weeks) singleton birthsLow birth weight (<2500g) singleton birthsExtracted variance in birth outcomes accounted for by maternal education, paternal education, and private insurance status at the individual level.Separate analyses for Blacks and Whites

39. Density of deteriorated structures

40. Density of pre-mature births

41. Density of low birth weight births

42. ResultsCorrelations with density of structural deteriorationRacePre-maturityLow birth weightAll.441***.500***Black.354***.336***White.228**.026N = 169; ** indicates p < .01, *** indicates p < .001. Controlling for maternal education, paternal education, and private insurance status.

43. ResultsThe density of dilapidated structures was highly skewed across sectors (Skewness = 2.02, SE = 0.19). Black births were overrepresented in areas with high structural deterioration RaceTop 25%Top 5%Black49%20%White22%6%Proportion of births by area level of deterioration

44. Conclusion

45. ConclusionConditions suggesting high extrinsic mortality rates predicted adverse birth outcomes.

46. ConclusionConditions suggesting high extrinsic mortality rates predicted adverse birth outcomes.Mechanisms regulating investment trade-offs based on environmental conditions may influence adverse birth outcomes.

47. ConclusionConditions suggesting high extrinsic mortality rates predicted adverse birth outcomes.Mechanisms regulating investment trade-offs based on environmental conditions may influence adverse birth outcomes.Legacy from times of considerably higher mortality rates, they may not promote reproductive success in modern environments (i.e. mismatch).

48. ConclusionConditions suggesting high extrinsic mortality rates predicted adverse birth outcomes.Mechanisms regulating investment trade-offs based on environmental conditions may influence adverse birth outcomes.Legacy from times of considerably higher mortality rates, they may not promote reproductive success in modern environments (i.e. mismatch).Interventions promoting desirable birth outcomes may be more effective if they attend to relevant environmental conditions.

49. Candidate risk factor 2:Low paternal investment

50. Candidate risk factor 2:Low paternal investmentMen provide considerably more paternal investment than males in most other primate species.

51. Candidate risk factor 2:Low paternal investmentMen provide considerably more paternal investment than males in most other primate species.Paternal investment is significantly related to offspring survival and success.

52. Candidate risk factor 2:Low paternal investmentMen provide considerably more paternal investment than males in most other primate species.Paternal investment is significantly related to offspring survival and success.Children growing up with fathers absent are at higher risk for a range of adverse outcomes.

53. Hypotheses

54. HypothesesWomen living in areas with relatively lower levels of paternal investment will have higher rates of prematurity and low birth weight.

55. HypothesesWomen living in areas with relatively lower levels of paternal investment will have higher rates of prematurity and low birth weight.Scarcity of men in a population will predict lower paternal investment and also higher rates of prematurity and low birth weight (directly and/or indirectly).

56. Part IIOperational Sex Ratio

57. Part IIOperational Sex RatioWhen the sex ratio is imbalanced, the rarer sex has increased leverage in inter-sexual relationships.

58. Part IIOperational Sex RatioWhen the sex ratio is imbalanced, the rarer sex has increased leverage in inter-sexual relationships.Men compete for (long-term) partners through signals of potential long-term relationship commitment and resource provisioning.

59. Part IIOperational Sex RatioWhen the sex ratio is imbalanced, the rarer sex has increased leverage in inter-sexual relationships.Men compete for (long-term) partners through signals of potential long-term relationship commitment and resource provisioning.Women compete for partners through signals of fecundity and sexual availability.

60. Part IIOperational Sex Ratio

61. Part IIOperational Sex Ratio Female scarcity: Women are more effective at securing commitment and obtaining higher investment from men.

62. Part IIOperational Sex Ratio Female scarcity: Women are more effective at securing commitment and obtaining higher investment from men.Higher male competition for signals of relationship commitment and paternal investment (Pederson, 1991).

63. Part IIOperational Sex Ratio Female scarcity: Women are more effective at securing commitment and obtaining higher investment from men.Higher male competition for signals of relationship commitment and paternal investment (Pederson, 1991). Difficult for low SES men to get married (Pollet & Nettle, 2007).

64. Part IIOperational Sex Ratio Female scarcity: Women are more effective at securing commitment and obtaining higher investment from men.Higher male competition for signals of relationship commitment and paternal investment (Pederson, 1991). Difficult for low SES men to get married (Pollet & Nettle, 2007).Higher expectations for paternal care (Guttentag & Secord, 1983).

65. Part IIOperational Sex Ratio Female scarcity: Women are more effective at securing commitment and obtaining higher investment from men.Higher male competition for signals of relationship commitment and paternal investment (Pederson, 1991). Difficult for low SES men to get married (Pollet & Nettle, 2007).Higher expectations for paternal care (Guttentag & Secord, 1983).Women marry at younger ages (Kruger et al., 2010).

66. Part IIOperational Sex Ratio Female scarcity: Women are more effective at securing commitment and obtaining higher investment from men.Higher male competition for signals of relationship commitment and paternal investment (Pederson, 1991). Difficult for low SES men to get married (Pollet & Nettle, 2007).Higher expectations for paternal care (Guttentag & Secord, 1983).Women marry at younger ages (Kruger et al., 2010).Promiscuity discouraged, especially for women (Guttentag & Secord, 1983).

67. Part IIOperational Sex Ratio Female scarcity: Women are more effective at securing commitment and obtaining higher investment from men.Higher male competition for signals of relationship commitment and paternal investment (Pederson, 1991). Difficult for low SES men to get married (Pollet & Nettle, 2007).Higher expectations for paternal care (Guttentag & Secord, 1983).Women marry at younger ages (Kruger et al., 2010).Promiscuity discouraged, especially for women (Guttentag & Secord, 1983).Greater protection/guarding of women (Scott, 1970).

68. Part IIOperational Sex Ratio Female scarcity: Women are more effective at securing commitment and obtaining higher investment from men.Higher male competition for signals of relationship commitment and paternal investment (Pederson, 1991). Difficult for low SES men to get married (Pollet & Nettle, 2007).Higher expectations for paternal care (Guttentag & Secord, 1983).Women marry at younger ages (Kruger et al., 2010).Promiscuity discouraged, especially for women (Guttentag & Secord, 1983).Greater protection/guarding of women (Scott, 1970).Brideprice paid by husband’s family (Herlihy, 1976).

69. Part IIOperational Sex Ratio Male scarcity: Male mating opportunities are enhanced, incentives for long-term commitment and investment are diminished.

70. Part IIOperational Sex Ratio Male scarcity: Male mating opportunities are enhanced, incentives for long-term commitment and investment are diminished.Higher divorce rates, more out-of-wedlock births and single mother households, lower paternal investment (Guttentag & Secord, 1983; Trent & South, 1989).

71. Part IIOperational Sex Ratio Male scarcity: Male mating opportunities are enhanced, incentives for long-term commitment and investment are diminished.Higher divorce rates, more out-of-wedlock births and single mother households, lower paternal investment (Guttentag & Secord, 1983; Trent & South, 1989).Shorter skirt lengths (Barber, 1999).

72. Part IIOperational Sex Ratio Male scarcity: Male mating opportunities are enhanced, incentives for long-term commitment and investment are diminished.Higher divorce rates, more out-of-wedlock births and single mother households, lower paternal investment (Guttentag & Secord, 1983; Trent & South, 1989).Shorter skirt lengths (Barber, 1999).Greater female promiscuity (Schmitt, 2005).

73. Part IIOperational Sex Ratio Male scarcity: Male mating opportunities are enhanced, incentives for long-term commitment and investment are diminished.Higher divorce rates, more out-of-wedlock births and single mother households, lower paternal investment (Guttentag & Secord, 1983; Trent & South, 1989).Shorter skirt lengths (Barber, 1999).Greater female promiscuity (Schmitt, 2005).Higher rates of teenage pregnancies (Barber, 2000).

74. Part IIOperational Sex Ratio Male scarcity: Male mating opportunities are enhanced, incentives for long-term commitment and investment are diminished.Higher divorce rates, more out-of-wedlock births and single mother households, lower paternal investment (Guttentag & Secord, 1983; Trent & South, 1989).Shorter skirt lengths (Barber, 1999).Greater female promiscuity (Schmitt, 2005).Higher rates of teenage pregnancies (Barber, 2000).Women are less likely to be married (Lichter, et al., 1992).

75. Part IIOperational Sex Ratio Male scarcity: Male mating opportunities are enhanced, incentives for long-term commitment and investment are diminished.Higher divorce rates, more out-of-wedlock births and single mother households, lower paternal investment (Guttentag & Secord, 1983; Trent & South, 1989).Shorter skirt lengths (Barber, 1999).Greater female promiscuity (Schmitt, 2005).Higher rates of teenage pregnancies (Barber, 2000).Women are less likely to be married (Lichter, et al., 1992). Women marry later (Kruger et al., 2010).

76. Part IIOperational Sex Ratio Male scarcity: Male mating opportunities are enhanced, incentives for long-term commitment and investment are diminished.Higher divorce rates, more out-of-wedlock births and single mother households, lower paternal investment (Guttentag & Secord, 1983; Trent & South, 1989).Shorter skirt lengths (Barber, 1999).Greater female promiscuity (Schmitt, 2005).Higher rates of teenage pregnancies (Barber, 2000).Women are less likely to be married (Lichter, et al., 1992). Women marry later (Kruger et al., 2010).Dowries paid by bride’s family (Herlihy, 1976).

77. HypothesisScarcity of men in a population will predict lower paternal investment and also higher rates of prematurity and low birth weight (directly and/or indirectly).♂♂♂♂♀♀♀♀♀♀♂♂♂♂♀♀♀♀♀♀♂♂♂♂♂♂♀♀♀♀♂♂Higher incidence of low birth weight and pre-mature gestationLower incidence of low birth weight and pre-mature gestation

78. Method

79. MethodCDC birth outcome statistics for 450 counties in the year 2000

80. MethodCDC birth outcome statistics for 450 counties in the year 2000 Sex Ratio (ages 18-64) calculated from the 2000 U.S. Census.

81. MethodCDC birth outcome statistics for 450 counties in the year 2000 Sex Ratio (ages 18-64) calculated from the 2000 U.S. Census.We predicted the proportions of low birthweight births >2500g) and premature gestation (Prop <37 weeks).

82. MethodCDC birth outcome statistics for 450 counties in the year 2000 Sex Ratio (ages 18-64) calculated from the 2000 U.S. Census.We predicted the proportions of low birthweight births >2500g) and premature gestation (Prop <37 weeks).Sex Ratio

83. MethodCDC birth outcome statistics for 450 counties in the year 2000 Sex Ratio (ages 18-64) calculated from the 2000 U.S. Census.We predicted the proportions of low birthweight births >2500g) and premature gestation (Prop <37 weeks).Sex Ratio % of families with children that are single mother households

84. MethodCDC birth outcome statistics for 450 counties in the year 2000 Sex Ratio (ages 18-64) calculated from the 2000 U.S. Census.We predicted the proportions of low birthweight births >2500g) and premature gestation (Prop <37 weeks).Sex Ratio % of families with children that are single mother households% Non-White

85. MethodCDC birth outcome statistics for 450 counties in the year 2000 Sex Ratio (ages 18-64) calculated from the 2000 U.S. Census.We predicted the proportions of low birthweight births >2500g) and premature gestation (Prop <37 weeks).Sex Ratio % of families with children that are single mother households% Non-WhiteSES:% Income below poverty levelMedian household income% High School graduates (25 years old and older)% 4-year College graduates (25 years old and older)

86. Results

87. Results

88. Male ScarcityLow Birth WeightPrematurityNon-WhiteSingle Mothers2(5) = 27.80, p < .001, GFI = .980, NFI = .981, CFI = .985, RMSEA = .101.36**.59**.12*.53**-.38**-.32SES.32**.07*.49***p < .01, **p < .001ResultsStandardized regression coefficients

89. Male ScarcityLow Birth WeightPrematurityNon-WhiteSingle Mothers.36**.59**.12*.53**-.38**-.32SES.32**.07*.49***p < .01, **p < .001ResultsStandardized regression coefficients2(5) = 27.80, p < .001, GFI = .980, NFI = .981, CFI = .985, RMSEA = .101

90. Male ScarcityLow Birth WeightPrematurityNon-WhiteSingle Mothers.36**.59**.12*.53**-.38**-.32SES.32**.07*.49***p < .01, **p < .001ResultsStandardized regression coefficients2(5) = 27.80, p < .001, GFI = .980, NFI = .981, CFI = .985, RMSEA = .101

91. Male ScarcityLow Birth WeightPrematurityNon-WhiteSingle Mothers.36**.59**.12*.53**-.38**-.32SES.32**.07*.49***p < .01, **p < .001ResultsStandardized regression coefficients2(5) = 27.80, p < .001, GFI = .980, NFI = .981, CFI = .985, RMSEA = .101

92. ResultsProportion Premature GestationPredictorBSEβtpConstant.121.014---8.73.001% Single moms.127.001.447.26.001% Non-White.022.006.173.50.001OSR Ages 18-64.000.000.143.88.001SES.000.000-.263.70.151Adjusted R2 = .425

93. ResultsProportion Low Birth WeightPredictorBSEβtpConstant.067.009---7.39.001% Single moms.153.011.6913.32.001OSR Ages 18-64.000.000.133.64.001% Non-White.012.004.122.83.005SES.000.000.092.47.014Adjusted R2 = .592

94. Results

95. ResultsThe proportion of families that are single mother households is the strongest predictor of prematurity and low birth weight.

96. ResultsThe proportion of families that are single mother households is the strongest predictor of prematurity and low birth weight.The sex ratio predicts single mother households independently of traditional SES indicators and proportion Non-White (mediated effect).

97. ResultsThe proportion of families that are single mother households is the strongest predictor of prematurity and low birth weight.The sex ratio predicts single mother households independently of traditional SES indicators and proportion Non-White (mediated effect).The sex ratio predicts prematurity and low birth weight independently of single mother households (direct effect).

98. Conclusion

99. ConclusionConditions suggesting relatively lower levels of paternal investment rates predicted adverse birth outcomes.

100. ConclusionConditions suggesting relatively lower levels of paternal investment rates predicted adverse birth outcomes.Interventions promoting desirable birth outcomes may be more effective if they attend to fatherhood and paternal support.

101. ConclusionConditions suggesting relatively lower levels of paternal investment rates predicted adverse birth outcomes.Interventions promoting desirable birth outcomes may be more effective if they attend to fatherhood and paternal support.Life History Theory is a powerful framework for understanding variation in adverse birth outcomes.

102. ConclusionConditions suggesting relatively lower levels of paternal investment rates predicted adverse birth outcomes.Interventions promoting desirable birth outcomes may be more effective if they attend to fatherhood and paternal support.Life History Theory is a powerful framework for understanding variation in adverse birth outcomes. Energy/ResourcesSomatic effortReproductive effortMaintenanceGrowthParentingMatingFutureoffspringCurrentoffspring

103. ConclusionConditions suggesting relatively lower levels of paternal investment rates predicted adverse birth outcomes.Interventions promoting desirable birth outcomes may be more effective if they attend to fatherhood and paternal support.Life History Theory is a powerful framework for understanding variation in adverse birth outcomes. Energy/ResourcesSomatic effortReproductive effortMaintenanceGrowthParentingMatingFutureoffspringCurrentoffspring

104. FINKRUGER@UMICH.EDU