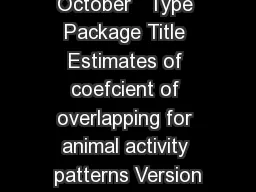
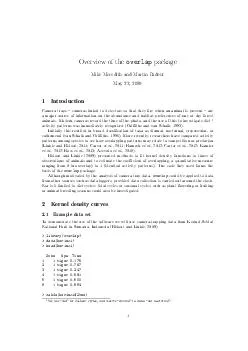
Modern cameras record the time of the photo and the use of this to investigate diel activity patterns was immediately recognised Gri64259ths and van Schaik 1993 Initially this resulted in broad classi64257cation of taxa as diurnal nocturnal crepuscu ID: 26230
Download Pdf The PPT/PDF document "Overview of the overlap package Mike Mer..." is the property of its rightful owner. Permission is granted to download and print the materials on this web site for personal, non-commercial use only, and to display it on your personal computer provided you do not modify the materials and that you retain all copyright notices contained in the materials. By downloading content from our website, you accept the terms of this agreement.
OverviewoftheoverlappackageMikeMeredithandMartinRidoutMay22,20201IntroductionCameratraps{cameraslinkedtodetectorssothattheyrewhenananimalispresent{areamajorsourceofinformationontheabundanceandhabitatpreferencesofrareorshyforestanimals.Moderncamerasrecordthetimeofthephoto,andtheuseofthistoinvestigatediel1activitypatternswasimmediatelyrecognised(GrithsandvanSchaik,1993).Initiallythisresultedinbroadclassicationoftaxaasdiurnal,nocturnal,crepuscular,orcathemeral(vanSchaikandGriths,1996).Morerecently,researchershavecomparedactivitypatternsamongspeciestoseehowoverlappingpatternsmayrelatetocompetitionorpredation(LinkieandRidout,2011;Carveretal.,2011;Rameshetal.,2012;Carteretal.,2012;Kamleretal.,2012;Rossetal.,2013;Azevedoetal.,2018).RidoutandLinkie(2009)presentedmethodstotkerneldensityfunctionstotimesofobservationsofanimalsandtoestimatethecoecientofoverlapping,aquantitativemeasurerangingfrom0(nooverlap)to1(identicalactivitypatterns).Thecodetheyusedformsthebasisoftheoverlappackage.Althoughmotivatedbytheanalysisofcameratrapdata,overlapcouldbeappliedtodatafromothersourcessuchasdataloggers,provideddatacollectioniscarriedoutaroundtheclock.Norisitlimitedtodielcycles:tidalcyclesorseasonalcycles,suchasplant oweringorfruitingoranimalbreedingseasonscouldalsobeinvestigated.2Kerneldensitycurves2.1ExampledatasetTodemonstratetheuseofthesoftwarewewillusecamera-trappingdatafromKerinci-SeblatNationalParkinSumatra,Indonesia(RidoutandLinkie,2009).library(overlap)data(kerinci)head(kerinci)ZoneSpsTime11tiger0.17521tiger0.78731tiger0.24741tiger0.59151tiger0.50061tiger0.564table(kerinci$Zone) 1Weuse\diel"for24-hourcycles,andreserve\diurnal"tomean\notnocturnal".1 0.00 0.04 0.08 tig2 Time Density 0:00 6:00 12:00 18:00 24:00 1234104425280289summary(kerinci$Sps)boarcloudedgoldenmacaquemuntjacsambartapirtiger288610427320025181201range(kerinci$Time)[1]0.0030.990Thedataprovidetime-of-capturedatafrom4ZoneswithintheParkfor8species:wildpig(\boar"),cloudedleopard,goldencat,pig-tailedmacaque,commonmuntjac,sambardeer,tapir,andtiger.Theunitoftimeistheday,sovaluesrangefrom0to1.Packageoverlapworksentirelyinradians:ttingdensitycurvesusestrigonometricfunctions(sin,cos,tan),sothisspeedsupbootstrapsandsimulations.Theconversionisstraightforward:timeRad-kerinci$Time*2*pi2.2FittingkerneldensityWewillextractthedatafortigersinZone2(whichhasthemostobservations)andplotakerneldensitycurve:ကtig2-timeRad[kerinci$Zone==2&kerinci$Sps=='tiger']ကdensityPlot(tig2,rug=TRUE) Figure1:FittedkerneldensitycurvefortigersinZone3,usingdefaultsmoothingparameters.Figure1showstheactivitypatternfrom21:00to03:00,areminderthatthedensityiscircular.UnliketheusualdensityplotthatusesaGaussiankernel,weuseavonMiseskernel,correspondingtoacirculardistribution.2 0.00 0.04 tig2 Time Density 0:00 6:00 12:00 18:00 24:00 adjust = 2 0.00 0.06 tig2 Time Density 0:00 6:00 12:00 18:00 24:00 adjust = 0.2 TheactualdataareshownatthefootofFigure1asa`rug'.Densityestimationinvolvessmoothingtheinformationinthedata,andthedegreeofsmooth-ingiscontrolledbytheargumentadjusttothedensityPlotfunction.Increasingadjustabovethedefaultvalueof1givesa attercurve,reducingitgivesamore`spiky'curve,asshowninFigure2.Thechoiceofadjustaectstheestimateofoverlap,aswediscussbelow. Figure2:Kerneldensitycurvesttedwithdierentsmoothingadjustments.3QuantifyingoverlapVariousmeasuresofoverlaphavebeenputforward:seeRidoutandLinkie(2009)forareview.WeusethecoecientofoverlappingproposedbyWeitzman(1970).3.1CoecientofoverlappingAsshowninFigure3,thecoecientofoverlapping,,isthearealyingunderbothofthedensitycurves.(Rememberthattheareaunderadensitycurveis,bydenition,one.)Mathematically,ifthetwodensitycurvesaref(x)andg(x),thisis:(f;g)=Zminff(x);g(x)gdx(1)Thisworksifweknowthetruedensitydistributions,f(x)andg(x);butweusuallyonlyhavesamplesandneedtoestimatefromthese.3 3.2EstimatorsFivegeneralnonparametricestimatorsofthecoecientofoverlappingwereproposedbySchmidandSchmidt(2006).Forcirculardistributions,thersttwoareequivalentandthethirdisunworkable(RidoutandLinkie,2009).Weretain^1,^4and^5.Therst,^1,matchesthedenitioninequation(1),butinpracticeitisestimatednumeri-cally,takingalargenumberofvalues,t1;t2;:::;tT,equallyspacedbetween0and2(ti=2i=T)andsumming:^1=1 TTXi=1minf^f(ti);^g(ti)g(2)For^4and^5,wecomparethedensitiesattheobservedvalues,x1;:::;xnforonespeciesandy1;:::;ymfortheother:^4=1 2 1 nnXi=1min(1;^g(xi) ^f(xi))+1 mmXi=1min(1;^f(yi) ^g(yi))!(3)^5=1 nnXi=1In^f(xi)^g(xi)o+1 mmXi=1In^g(yi)^f(yi)o(4)whereI(:)is1iftheconditionintheparenthesisistrue,0otherwise.Theterms^f(:)and^g(:)refertothettedkerneldensityfunctions,andassuchtheyareaectedbythechoiceofthesmoothingconstant,adjust.Onthebasisofsimulations,RidoutandLinkie(2009)recommendusingadjust=0.8toestimate^1,adjust=1for^4,andadjust=4for^5.(Notethatadjustintheoverlapfunctionscorrespondsto1=cinRidoutandLinkie(2009)).Thesearethedefaultvaluesusedinoverlapfunctions.3.3ChoiceofestimatorRidoutandLinkie(2009)carriedoutsimulationswithavarietyofscenarioswherethetrueoverlapwasknown,andcomparedtheresultingestimateswiththetruth,calculatingtherootmeansquarederror(RMSE)foreachestimator.Thepresentauthorshavecarriedoutfurthersimulationsinthesamemanner.Wefoundthatthebestestimatordependedonthesizeofthesmallerofthetwosamples:Whenthesmallersamplewaslessthan50,^1performedbest,while^4wasbetterwhenitwasgreaterthan75.Innocasewas^5foundtobeuseful.Itisunstable,inthatsmall,incrementalchangesinthedataproducediscontinuouschangesintheestimate,anditcangiveestimatesgreaterthanone.3.4ExamplesWewillseehowthisworkswiththekerincidataset.WewillextractthedatafortigersandmacaquesforZone2,calculatetheoverlapwithallthreeestimators,andplotthecurves:tig2-timeRad[kerinci$Zone==2&kerinci$Sps=='tiger']ကmac2-timeRad[kerinci$Zone==2&kerinci$Sps=='macaque']ကmin(length(tig2),length(mac2))[1]83ကtigmac2est-overlapEst(tig2,mac2,type="Dhat4")ကtigmac2est4 0.00 0.04 0.08 0.12 Zone 2 Time Density 0:00 6:00 12:00 18:00 24:00 Tigers Macaques Dhat40.4205464overlapPlot(tig2,mac2,main="Zone2")legend('topright',c("Tigers","Macaques"),lty=c(1,2),col=c(1,4),bty='n') Figure3:ActivitycurvesfortigersandmacaquesinZone2.Thecoecientofoverlappingequalstheareabelowbothcurves,shadedgreyinthisdiagram.Bothofthesesampleshavemorethan75observations,sowechosetousethe^4estimate,Dhat4intheRcode,givinganestimateofoverlapof0.42.4CondenceintervalsToestimatecondenceintervalsweneedtoknowthesamplingdistributionwhichourcoecientofoverlappingisdrawnfrom,ie,thedistributionwewouldgetifwehadaverylargenumberofindependentsamplesfromnature.Thebestwaytoinvestigatethisistouseabootstrap.4.1ThebootstrapTheusualbootstrapmethodtreatstheexistingsampleasrepresentativeofthepopulation,andgeneratesalargenumberofnewsamplesbyrandomlyresamplingobservationswithreplacementfromtheoriginalsample.Forthecaseofestimatingactivitypatterns,thismaynotworkverywell:supposeouroriginalsampleforanocturnalspecieshasobservationsrangingfrom20:58to03:14;resamplingwillneveryieldanobservationoutsidethatrange,whileafreshsamplefromnaturemaydoso.Analternativeisasmoothedbootstrap.Webeginbyttingakerneldensitytotheoriginaldatathendrawrandomsimulatedobservationsfromthisdistribution.Facedwithoriginalvaluesbetween20:58and03:14,mostsimulatedobservationswouldfallinthesamerange,butafewwillfalloutside.Intheoverlappackage,wegeneratebootstrapsampleswithbootstrap,whichhasasmoothargument;ifsmooth=TRUE(thedefault),smoothedbootstrapsamplesaregenerated.Forthis5 example,wewillgeneratejust1000bootstrapestimatesfortigersandmacaquesinZone2;forarealanalysis10,000bootstrapsampleswouldbebetter:tigmac2-bootstrap(tig2,mac2,1000,type="Dhat4")#takesafewsecondsက(BSmean-mean(tigmac2))[1]0.4747555Notethatthebootstrapmean, BS,diersfrom^:0.47versus0.42.Thedierence, BS^,isthebootstrapbias,andweneedtotakethisintoaccountwhencalculatingthecondenceinterval.Ifthebootstrapbiaswereagoodestimateoftheoriginalsamplingbias,abetterestimatorofwouldbe~=2^ BS.Oursimulationsshowthat~resultsinhigherRMSEthantheoriginal^,sowedonotrecommendapplyingthiscorrection.4.2ExtractingtheCIOnewaytoestimatethecondenceintervalissimplytolookattheappropriatepercentilesofthesetofbootstrapestimates(interpolatingbetweenvaluesifnecessary):fora95%condenceintervalthesewouldbethe2.5%and97.5%percentiles.Thisispercintheoutputfromoverlap'sbootCIfunction.WenotedattheendofSection4.1that,onaverage,thebootstrapvaluesdierfromtheestimate:thisisthebootstrapbias.Therawpercentilesproducedbypercneedtobeadjustedtoaccountforthisbias.Theappropriatecondenceintervalisperc( BS^);thisisbasic0inthebootCIoutput.Analternativeapproachistousethestandarddeviationofthebootstrapresults,(sBS),asanestimateofthespreadofthesamplingdistribution,andthencalculatethecondenceintervalas^z=2sBS.Usingz0:025=1:96givestheusual95%condenceinterval.Thisisnorm0inthebootCIoutput.Thisprocedureassumesthatthesamplingdistributionisnormal.Ifthat'sthecase,norm0willbeclosetobasic0,butifthedistributionisskewed{asitwillbeif^iscloseto0or1{basic0isthebetterestimator.Forthetiger-macaquedatafromZone2wehavethefollowingestimatesofa95%condenceinterval:bootCI(tigmac2est,tigmac2)loweruppernorm0.26859860.4640759norm00.32280770.5182851basic0.26770850.4622655basic00.32461810.5191751perc0.37882720.5733842bootCIproducestwofurtherestimators:basicandnorm.Theseareanalogoustobasic0andnorm0butareintendedforusewiththebias-correctedestimator,~.Theymatchthebasicandnormcondenceintervalsproducedbyboot.ciinpackageboot.Thecoecientofoverlappingtakesvaluesintheinterval[0,1].Allthecondenceintervalestimatorsexceptpercinvolveadditivecorrectionswhichmightresultinvaluesoutsideofthisrange.Thiscanbeavoidedbycarryingoutthecorrectionsonalogisticscaleandback-transforming.ThisisdonebybootCIlogit:bootCIlogit(tigmac2est,tigmac2)6 loweruppernorm0.28185520.4643805norm00.32809590.5189280basic0.28156050.4634323basic00.32893700.5192916perc0.37882720.5733843Inthisexample,theCIsarewellawayfrom0or1,sothedierenceissmall(andpercisexactlythesameasthere'snocorrectionanyway).4.3ChoiceofCImethodIfaseriesofX%condenceintervalsarecalculatedfromindependentsamplesfromapopulation,wewouldexpectX%ofthemtoincludethetruevalue.Whenrunningsimulationsweknowthetruevalueandcanchecktheactualproportionofcondenceintervalswhichcontainthetruevalue:thisisthecoverageoftheestimator.Ideallythecoverageshouldequalthenominalcondenceinterval,ie,95%coveragefora95%condenceinterval.Weranalargenumberofsimulationswithdierenttruedistributionsandsamplesizes(seeRidoutandLinkie(2009)fordetails).Foreachscenario,weranbothsmoothedandunsmoothedbootstraps,extractedallnine95%condenceintervals,andcheckedthecoverageforeach.Eachestimatorgavearangeofcoverages.Welookedforamethodwhichgavemediancoverageclosesttothenominal95%andallormostvaluesabove90%.Thiswassatisedbythebasic0estimatorwithsmoothedbootstraps.Withsmallsamples(smallersample75)and]TJ/;ø 9;.962; Tf; 10.;Ч ; Td; [00;0:8,coveragesometimesfellbelow90%,butnoneoftheotheroptionsfaredbetter.5SummaryofrecommendationsUsethe^4estimator(Dhat4)ifthesmallersamplehasmorethan75observations.Oth-erwise,usethe^1estimator(Dhat1).Useasmoothedbootstrapanddoatleast1000resamples,preferably10,000.Usethebasic0outputfrombootCIasyourcondenceinterval;beawarethatthiscon-denceintervalwillbetoonarrowifyouhaveasmallsampleandiscloseto1.6Caveats6.1PoolingdataPooleddatagivehigherestimatesofoverlapthantheoriginal,unpooleddata(RidoutandLinkie,2009).Supposewendaspeciesofbatthatemergesimmediatelyaftersunsetandahawkwhichgoestoroostjustbeforesunset:theiractivitypatternsdonotoverlapandpresumablythehawkwillnotbefeedingonthebats.Butthetimeofsunsetchanges;datafromDecemberonlyorfromJuneonlyshownooverlap,butthepooleddatado,andthisapparentoverlapisanartefactofpooling.Thisisaclear-cutexample.Ingeneral,dierencesinactivitypatternsacrosssitesortimeperiodswillbesmaller,butanyheterogeneitywillin atetheoverlapestimatesfrompooleddata.Careisneededwhencomparingcoecientsofoverlapamongstudyareasorperiodsofvaryingextentordegreeofheterogeneity.Onewaytomitigatethesedierencesistomap"clocktime"to"suntime"(Nouvelletetal.,2012).ThenewfunctionsunTimeallowsthistobedone,seeitshelppage.Azevedoetal.(2018)usedthisapproachfortheirstudyofpuma.7 6.2What\activity"isobserved?Cameratrapssetalonganimaltrails{astheyoftenare{recordinstancesofanimalsmovingalongtrails.Theresulting\activitypattern"referstowalkingontrails,andoverlapindicatestheextenttowhichtwospeciesarewalkingontrailsatthesameperiodoftheday.Abrowsingherbivoreandthecarnivorestalkingitareprobablyboth\inactive"bythisdenition.Inviewofthis,conclusionsaboutspeciesinteractionsneedtobedrawnwithcare.InastudyinLaoPDR,Kamleretal.(2012)foundthatdholeandpigwereactiveduringthedayanddeeratnight.Thismightsuggestthatdholefeedonpigratherthandeer.Butexaminationofdholefaecesshowedthatdholeconsumedmainlydeerandverylittlepig.7ReferencesAzevedoFC,LemosFG,Freitas-JuniorMC,RochaDG,AzevedoFCC(2018).\Pumaactivitypatternsandtemporaloverlapwithpreyinahuman-modiedlandscapeatSoutheasternBrazil."JournalofZoology,0(0),0.CarterNH,ShresthaBK,KarkiJB,PradhanNMB,LiuJ(2012).\Coexistencebetweenwildlifeandhumansatnespatialscales."ProceedingsoftheNationalAcademyofSciences,109(38),15360{15365.CarverBD,KennedyML,HoustonAE,FranklinSB(2011).\Assessmentoftemporalpartition-inginforagingpatternsofsyntopicVirginiaopossumsandraccoons."JournalofMammalogy,92(1),134{139.GrithsM,vanSchaikCP(1993).\Camera-trapping:anewtoolforthestudyofelusiverainforestanimals."TropicalBiodiversity,1,131{135.KamlerJF,JohnsonA,VongkhamhengC,BousaA(2012).\Thediet,preyselection,andactivityofdholes(Cuonalpinus)innorthernLaos."JournalofMammalogy,93(3),627{633.LinkieM,RidoutMS(2011).\Assessingtiger-preyinteractionsinSumatranrainforests."Jour-nalofZoology,284(3),224{229.NouvelletP,RasmussenGSA,MacdonaldDW,CourchampF(2012).\Noisyclocksandsilentsunrises:measurementmethodsofdailyactivitypattern."JournalofZoology,286(3),179{184.RameshT,KalleR,SankarK,QureshiQ(2012).\Spatio-temporalpartitioningamonglargecarnivoresinrelationtomajorpreyspeciesinWesternGhats."JournalofZoology,287(4),269{275.RidoutMS,LinkieM(2009).\Estimatingoverlapofdailyactivitypatternsfromcameratrapdata."JournalofAgricultural,Biological,andEnvironmentalStatistics,14(3),322{337.RossJ,HearnAJ,JohnsonPJ,MacdonaldDW(2013).\Activitypatternsandtemporalavoid-ancebypreyinresponsetoSundacloudedleopardpredationrisk."JournalofZoology,290(2),96{106.SchmidF,SchmidtA(2006).\Nonparametricestimationofthecoecientofoverlapping|theoryandempiricalapplication."ComputationalStatisticsandDataAnalysis,50,1583{1596.8 vanSchaikCP,GrithsM(1996).\ActivityperiodsofIndonesianrainforestmammals."Biotropica,28(1),105{112.WeitzmanMS(1970).\MeasureoftheOverlapofIncomeDistributionofWhiteandNegroFamiliesintheUnitedStates."Technicalreport22,U.S.DepartmentofCommerce,BureauoftheCensus,Washington,DC.9