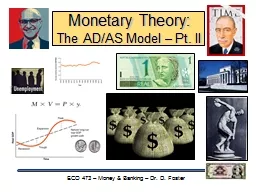
/
The Demand ECO 473 - Money & Banking - Dr. D. Foster for Money The Demand ECO 473 - Money & Banking - Dr. D. Foster for Money

The Demand ECO 473 - Money & Banking - Dr. D. Foster for Money - PowerPoint Presentation

calandra-battersby
calandra-battersby . @calandra-battersby
Follow
344 views
Uploaded On 2019-11-02

The Demand ECO 473 - Money & Banking - Dr. D. Foster for Money - PPT Presentation

The Demand ECO 473 Money amp Banking Dr D Foster for Money The Demand for Money The motives for holding money Money demand as a medium of exchange The Cambridge equation The Inventory model ID: 762217

demand money interest income money demand income interest 000 amp bonds relationship decrease phase real rises bond increase year

Share:

Link:

Embed:

Download Presentation from below link

Download Presentation The PPT/PDF document "The Demand ECO 473 - Money & Banking..." is the property of its rightful owner. Permission is granted to download and print the materials on this web site for personal, non-commercial use only, and to display it on your personal computer provided you do not modify the materials and that you retain all copyright notices contained in the materials. By downloading content from our website, you accept the terms of this agreement.


Presentation Transcript

The Demand ECO 473 - Money & Banking - Dr. D. Foster for Money

The Demand for MoneyThe motives for holding money Money demand as a medium of exchange The Cambridge equation.The Inventory model.Friedman approach.Rothbard approach. Money demand as a store of valueKeynes’ portfolio demand.

1. The Cambridge EquationMoney is only used for making purchases. For some given income, Y, you plan to hold some given fraction, k, to facilitate purchases.As Y rises (falls), the Md rises (falls). M d = k  Y Divide through by the price level (P) to get real money demand and real income. m d = k  y

Money Demand Worksheet #1Using the Cambridge model … 1. If k=10%, what is md if income is $10,000? 2. If k=10%, what is md if income is $20,000? 3. If y=$20,000 and prices rise 50%, what is md? Md?4. If k rises to 12%, what is md if income is $15,000? Show each of these outcomes on a single graph with income on the horizontal axis and real money balances on the vertical axis. [Except for the second part of #3, which asks for the nominal money demand.] y m md

Annual Spending Patterns with a Constant Rate of Spending for y = $36,000 Average money holdings equals … ? $18,000 $9,000 $1,500

Money Demand Worksheet #2You are paid $50,000 per year in equal amounts every 3 months. You have $5,000 permanently saved in a checking account. You pay taxes of 7.4% on your income each pay period. You allocate $2,000 per pay period to the purchase of bonds. The remainder of your income you spend in equal increments per day over the pay period. 1. What is m d? Show the graph.2. If taxes rise to 9.5%, what is m d? Show the graph.3. If you decrease bonds to $1500, what is md? Show the graph.

2. The Inventory Approach to Money DemandWhat is the optimal money balance to hold? Assumptions: On-hand money earns no interest.People earn a fixed amount of real income. People buy goods and services at a constant rate.People hold either money or bonds. Bonds earn an interest return of r. Converting from bonds to money costs a fee, f. Conversion made n times/year in constant amounts. Find n that minimizes total cost.

The Total Cost of Maintaining a Cash Inventory How many conversions to make per year? Whatever minimizes your total cost. Total cost = fees + lost interest m d = ∙  

Money Demand Worksheet #3Suppose that bonds earn 5% per year and that the fixed fee to convert bonds to money is $10 (no matter how much is converted). Assume real income is $65,000 per year. 1. What is n? What is md ?2. If income falls to $53,000, what is n & md? 3. If the fee rises to $25, what is n & md?4. If bond interest falls to 3%, what is n & md?5. If bond interest rises to 7%, what is n & md?

Summarizing factors affectingreal money balances Real income :A rise in y causes an increase in md. A fall in y causes a decrease in md. The interest rate:An increase in r causes a decrease in md. A decrease in r causes an increase in md .The cash-conversion fee:An increase in f causes an increase in md.A decrease in f causes a decrease in md.

3. Friedman approach Money demand varies with … Permanent Income. + relationship.Interest spread between bonds & money.- relationship. Interest spread between stocks & money.- relationship.Inflationary expectations. - relationship.

4. Rothbard approach Money demand varies with … Frequency of payments. - relationship. Sophistication of the clearing system. - relationship. Confidence in money (esp. paper). + relationship. Inflationary expectations. - relationship. Mises: Phase I Phase II Phase III

Rothbard presentationMoney S&D in the context of the ppm: m s' ppm m s $ m d m d'' m d' In Phase I, MS rises but its effects are offset by  Md. In Phase II, Md falls, incorporating inflationary expectations. Phase III, further increases in MS are constantly offset by declines in Md as people seek to have zero cash.

Keynes & the Portfolio DemandThe speculative demand for money: Relates to money held as a store of value. We seek to maximize our wealth over time.Our wealth is held in the form of bonds.Holding money allows us to time bond purchases. At “ high” interest rates, we expect them to fall … raising bond prices; strategy - buy bonds now. At “low” interest rates, we expect them to rise …lowering bond prices; strategy - sell bonds now.

Keynesian Money Demand r m m d(S) m d(T) r m Money demanded for transactions purposes in the Cambridge equation isn’t related to the interest rate. [Also, Friedman & Rothbard.] Keynes’ speculative demand shows money is related to the interest rate.

The Demand ECO 473 - Money & Banking - Dr. D. Foster for Money