/
FLOOD FREQUENCY ANALYSIS FLOOD FREQUENCY ANALYSIS

FLOOD FREQUENCY ANALYSIS - PowerPoint Presentation

catherine
catherine . @catherine
Follow
0 views
Uploaded On 2024-03-13

FLOOD FREQUENCY ANALYSIS - PPT Presentation

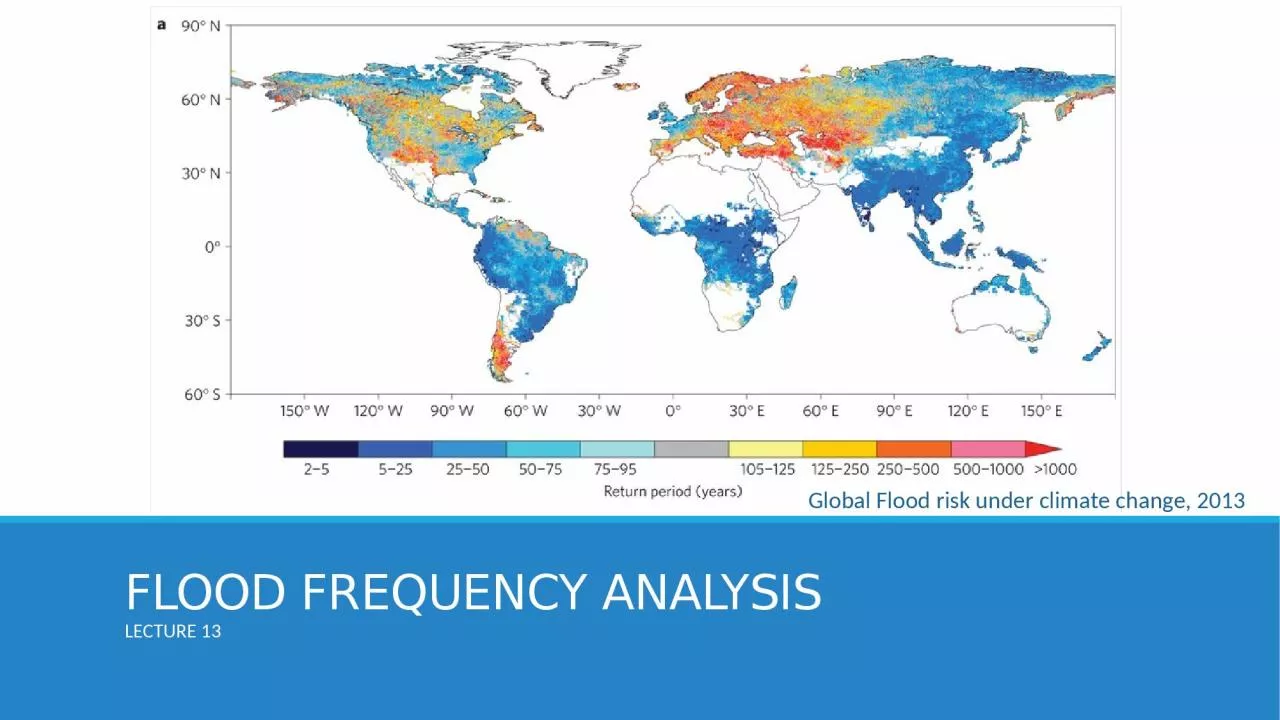
LECTURE 13 Global Flood risk under climate change 2013 FLOOD FREQUENCY ANALYSIS It is a statistical probabilistic method Flood magnitudes are determined corresponding to different return periods ID: 1048028

frequency flood floods method flood frequency method floods year annual data magnitude return base methods period time number occur

Share:

Link:

Embed:

Download Presentation from below link

Download Presentation The PPT/PDF document "FLOOD FREQUENCY ANALYSIS" is the property of its rightful owner. Permission is granted to download and print the materials on this web site for personal, non-commercial use only, and to display it on your personal computer provided you do not modify the materials and that you retain all copyright notices contained in the materials. By downloading content from our website, you accept the terms of this agreement.


Presentation Transcript

1. FLOOD FREQUENCY ANALYSISLECTURE 13Global Flood risk under climate change, 2013

2. FLOOD FREQUENCY ANALYSISIt is a statistical probabilistic methodFlood magnitudes are determined corresponding to different return periodsPast flood data is usedAccuracy of this method depends on the length of past data recordRecommended length of data record required for this method is 30 yearsIf it is less than 10 years flood frequency analysis should not be carried out on this data

3. INTRODUCTION “The frequency is the number of time that a given magnitude flood may occur in a given period.”Knowledge of the magnitude and probable frequency of recurrence of flood is necessary forEconomical and safe design of bridges, dams, levees, culverts and other structuresEffective management of flood plains, flood defense schemesTo predict possible flood magnitude over a certain time periodTo estimate the frequency with which floods of a certain magnitude may occur

4. METHODS OF COMPILING FLOOD DATAThere are two methods of treating data for studying frequency analysis1. annual flood series2. partial duration analysis

5. ANNUAL FLOOD SERIESAn annual flood is defined as the highest momentary peak discharge in a water year.The use of only one flood in each year is the most frequent objection to the use of annual floods.Infrequently, the second highest flood in a given year, which is omitted in the above definition, may outrank many annual floods.1990199119921993Qtime

6. PARTIAL DURATION FLOOD SERIESThe objection noted under annual floods is resolved by listing all floods that are greater than a selected base without regard to number within any given time period. The base is generally selected as equal to the lowest annual flood so that at least one flood in each year is included, however, in a long record, the base is generally raised so that on the average only 3 or 4 floods a year are included.But sometimes there may be no flood in a year and may be three or four peaks occur in the same year if base flood selected is not the minimum1990199119921993QtimeQSel

7. RETURN PERIOD/RECURRING INTERVAL (T) “ return period is the average number of years during which a flood of a given magnitude will be equaled or exceeded once.” or “it is time interval after which a similar flood can be expected.” where P is probability of occurence 

8. METHODS TO DETERMINE THE RETURN PERIODEmpirical methods are most commonly used1. California method 2. Allen Hazen method 3. Weibull method 4. Gumbel’s method  N: Number of eventsm: order no. when floods are sorted in descending orderm=1 for highest flood in recordm=N for lowest flood in recordc=  

9. NUMERICAL PROBLEMYearFlood (m3/s)198148001982440019834600198450001985460019863800YearFlood (m3/s)198736001988370019892410199025001991350019923500For the data record find out the return periods using California Method 2. Allen Hazen MethodWeibull Method 4. Gumbel MethodAlso compute the frequency.