/
Social Skills Improvement System – Rating Scales (SSIS-RS): A Test Review Social Skills Improvement System – Rating Scales (SSIS-RS): A Test Review

Social Skills Improvement System – Rating Scales (SSIS-RS): A Test Review - PowerPoint Presentation

celsa-spraggs
celsa-spraggs . @celsa-spraggs
Follow
423 views
Uploaded On 2019-11-20

Social Skills Improvement System – Rating Scales (SSIS-RS): A Test Review - PPT Presentation

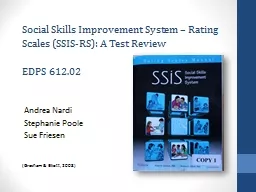
Social Skills Improvement System Rating Scales SSISRS A Test Review EDPS 61202 Andrea Nardi Stephanie Poole Sue Friesen Gresham amp Elliott 2008 Outline Test Overview Test Organization ID: 765911

skills social student scale social skills scale student problem behaviours forms scales form amp teacher behaviour sample parent subscale

Share:

Link:

Embed:

Download Presentation from below link

Download Presentation The PPT/PDF document "Social Skills Improvement System – Rat..." is the property of its rightful owner. Permission is granted to download and print the materials on this web site for personal, non-commercial use only, and to display it on your personal computer provided you do not modify the materials and that you retain all copyright notices contained in the materials. By downloading content from our website, you accept the terms of this agreement.


Presentation Transcript

Social Skills Improvement System – Rating Scales (SSIS-RS): A Test ReviewEDPS 612.02 Andrea NardiStephanie PooleSue Friesen (Gresham & Elliott, 2008)

OutlineTest OverviewTest Organization Administration, scoring, & interpretation Psychometric Properties: Analysis & EvaluationStandardization Sample and Norms ReliabilityValidityStrengths and Limitations Summary

Test Overview : Use/PurposeMulti-rater (teacher, parent, student)Screening and assessment StrengthsAcquisition and performance deficitsInterventionIdentify candidates for intervention servicesTrack progress Pre-and post-treatment comparisonProvide longitudinal data for research

Test Organization *Students 8-12 don’t rate importance of problem behaviours

Test Organization

Test Organization

AdministrationStraightforward administration Four forms: Student 8-12 years Student 13-18 yearsParent (3-18 years)Teacher (3-18 years)Time: 15-20 mins per formReading ability – Gr. 2 for student forms, Gr. 5 for parent* Don’t need to use all forms, but authors strongly encourage as child’s behaviour is influenced by setting.

Administration This is from the Student 13-18 form ↑  From the Student 8-12 form

ScoringComputer scoring: Links to relevant instructional units in SSIS Intervention GuideStandard, Multirater, and Progress ReportsIncludes response pattern index and response consistency indexScores are Standard Scores (mean 100, SD=15) or Percentile Ranks Hand scoring:Instructions in manualMust deal with: adjustment values for missing items F index for negative style Make summary table of raw scores  choose norm group  confidence interval  select appropriate behaviour level for each scale.

InterpretationRequires extra trainingCan obtain three kinds of reports to interpret (Standard, Multirater , or Progress)Begin with score interpretation for each scale and subscale.Look for overall pattern of strengths and weaknessesUses Model of Social Behavioural Strengths and Weaknesses

Interpretation: Model of Social Behavioral Strengths and Weaknesses    Model Descriptor Conditions   Actions & Interventions Best Case                                        Needs Work Social Skills StrengthsSocial Skills above averageHigh frequency and belief of behaviours.Reinforce to maintain Use student as modelSocial Skills Performance DeficitsSocial Skills below averageLower frequency of important or critical behaviours in subscaleUse behaviour techniques to increase practice and performance of desired social skillsSocial Skills Acquisition DeficitsSocial Skills below averageVery low or no frequency of some important behaviours in subscale.Direct instruction of desired social behaviour using SSIS Intervention Guide or other interventions.Competing Problem Behaviors Problem Behaviors above averageProblem behaviours are high frequency even if important.Collect further information about problem behaviours and use behaviour techniques to reduce.   -------------------------------- 

SSRS to SSISRevision of SSRS (feedback from 2 focus groups)Update norms and improve measures ages 3-5 Added four new subscales:Social Skills (2 new subscales)Problem Behavior (2 new subscales)Improve alignment of content across all raters’ formsImprove psychometric properties Add validity scalesAdd Spanish versionConnect assessment results to interventions

Psychometric Properties - StandardizationSeptember 2006- October 2007Data collected from nationwide sample totaling 4700 children, aged 3-18assessed at 115 sites across 36 states Two versions of the teacher form were standardized (preschool and elementary/secondary )One parent form Two student forms (elementary and secondary)(Spanish forms (parent and student) were also used in standardization)

Psychometric Properties – Norm SampleBased on the Current Population Survey (March 2006, U.S. Census Bureau)Applied to the 3 norm groupspreschool (age 3-5) two school-age groups (age 5-12, and 13-18)Each age group sample was designed to Have equal numbers of male and female Match the U.S. population with regard to geographic region, socioeconomic status, and race/ethnicity Inclusion of special populations

Analysis – Standardization Sample and Demographics Good sample size (4700 students) Large number of sites (115 sites in 36 States) Three norm groups set up by ages according to 2006 Census data Stratification of sample on various factors Not enough rationale for why some states left out and how it could affect the outcome. 5-year olds were used in both preschool and elementary forms Not enough information about special education program placement

Analysis – Execution of Norming Procedures Site coordinators had a good level of training and qualifications.Attempt to control teacher rating skewness Recruitment of participants limits generalization of norms to those unlikely to have been recruited .Compensation issuesIssue of unreturned formsParents who filled out forms overwhelmingly mothers Missing data and unusual scores – did they keep or not? Confusing to sort out numbers of children who were rated by all three forms, two forms, or just one form.

Analysis – Norm Group and Score ConstructionOverall good description of standard score construction from mean raw scores for each subscale. Especially good description of why they couldn’t normalize the distribution of Problem Behaviours and Social Skills.Percentile ranks created to allow for correct placement of scores even considering sampling fluctuations.Overall were able to separate norms for boys and girls, and had good representation in age bands except:Preschool – parents slightly over-represented Developmental Delay and Speech/Language Impairment 13-18 yr. band – ADHD slightly over-represented by teachers Specific Learning Disabilities underrepresented

Analysis – Size of Special Populations Groups Good Mediocre Poor ADHD (30-60 cases) Autism Spectrum Disorder (only 9 student forms, but 40+ for T & P) Developmental Delay (no student forms, <20 for T & P) Gifted/Talented (30-60 cases) Emotional / Behavioural Disturbance (9 student, <20 for P & S) Specific Language Disability (20-40 cases) Intellectual Disability (<20 for all forms) (Crosby, 2011; Lee-Farmer & Meikamp , 2010)

Psychometric Properties - Reliabilty

Internal Consistency ReliabilityMedian Scale Reliabilities (high)Social skills: mid- to upper .90s for all age groups (3-5, 5-12, 13-18) Problem Behaviours: mid- to upper .90s for all age groupsAcademic competence: upper .90s for (5-12, 13-18)Median Subscale Reliabilities (satisfactory)Teacher form: high .80sParent form: mid .80sStudent form: near .80

Internal Consistency Reliability Median Scale Reliabilities are considered high and indicate that the scale scores are relatively free from the influence of random errorMedian Subscale Reliabilities are satisfactory, sufficient for analyzing strengths as weaknesses and aiding development of intervention plansBehaviours comprising each subscale generally reflects a common dominant trait Are lower reliability coefficients (e.g., student subscales) adequate for purposes other than intervention planning

Test-Retest Reliability TeacherParent Studentr Adj r b r Adj r b r Adj r b Social Skills .84 .82 .86 .84 .80 .81 Problem Behaviour .81.83.87.87.74.77Academic Competence.93.92    Median Scale Correlation.84.83.87.86.77.79Median SubscaleCorrelation.82.81.83.80 .68 .71

Test-Retest ReliabilityC onfirmed with average scores remaining stable following second administrations of the instrument with teachers, parents, and student completers Each sample was representative Includes adjusted correlation coefficientMean interval (teacher-43 days, parent-62 days, student 66 days) Student Form : subscale reliability coefficients range from .59 to .81. M ay suggest that students interpret the behavioural statements less consistently across occasions

Inter-Rater Reliability Teacher Parent r Adj r b r Adj r b Social Skills .70 .68 .62 .62 Problem Behaviour .57 .61 .47 .50 Academic Competence .62.60  Median Scale Correlation.62.61.55.56Median SubscaleCorrelation.56.58.58.59

Inter-Rater ReliabilityMost subscale coefficients for both forms were in the upper .50s to .60s (moderate-good reliability)Each sample included students from each of the demographic categories of sex, race/ethnicity, parent’s education, region of countryLow frequency behaviours might not be well represented and skew distribution and result in smaller correlations Relationships between raters and students varied widely G enerally , several weeks elapsed between ratings (mean interval; teacher-63 days, parent-58 days ). How might this have impacted ratings? What was the reason for it?

Content ValidityEstablished using a developmental teamContent guidelines and key terms/items used to develop items for the Social Skills scale DSM-IV-TR and individual expertise used to develop Problem Behaviors subscalesUsed only items with a moderate to strong relationship with respective subscales

Analysis—Content ValidityScales based on a broad survey of empirical literature Previous research in the area of social behaviour and its relationship to student achievement support the division of classroom behaviours into: social skills, problem behaviours and academic competenceLittle information about who made up the development team and their qualificationsThe Behaviour Problem scale describes only a narrow range of problem behaviours

Construct Validity: Internal StructureSSIS-RS designed to assess social behaviours that affect student-teacher and parent-child relationships, peer acceptance and academic performance Social Skills subscale correlations—positive and moderate to highProblem Behavior subscale correlations—positive and highCorrelations between Social Skills and Problem Behaviors scales were moderate and negative (-.42 and -.65)Teacher Forms: Academic Competence was correlated positively and moderately with the Social Skills scales (.50 to .53) and moderately, negatively between Academic Competence and Problem Behaviors scale scores (-.41 to -.44)

Analysis—Construct Validity Pattern of inter-correlations among scales and subscales consistent with test authors’ predictions Individual with a high score on the Problem Behaviours scale should obtain a low score on Social Skills scale Social Skills scale and Academic Competence scale should have a positive and moderate correlation Academic Competence scale and Problem Behaviours scale should correlate moderately and negatively Scale items reflect an “adult perspective” Less representative of peer interactions

Validity StudiesThe SSIS-RS was also compared to several other measures:Behavior Assessment System for Children—2 nd Ed.Teacher Form: Social Scales highly correlated (.76-.78) Problem Behaviour scale and BASC-2 Behavioral Symptoms Index highly correlated (.71-.95)Parent Form: Correlations are moderate to high on the Social Skills scale (.57-.80) and high for Problem Behaviours (.80’s)Student Form: None of the scales corresponded closelyVineland Adaptive Behavior Scales, Second EditionTeacher Form: Social Skills correlated moderately with the Socialization domain (.64) and the Daily Living Skills (.68) Vineland Communication Domain correlated moderately with the Academic Competence scale (.75) Parent Form: Social Skills scale showed a low to moderate correlation with the Socialization Domains (.48)

Analysis—Validity Studies In general, correlations were as expected across the forms with scales measuring similar behaviours correlating more highly than scales measuring dissimilar behaviours The student forms on the BASC-2 show very little correlation despite the BASC-2 including 4 scales of prosocial behaviour This trend is particularly noticeable in the younger age groups

Strengths and Limitations StrengthsAdministration and scoring-- straightforward and quickLow readability levelParallel Teacher, Parent and Student formsOption for re-administering the scales every 4 weeks Scales within a multi-tiered modelLimitations “Special Population” studies have small sample sizes Relatively small sample for the Spanish version of the SSIS-RS “Adult perspective” reflected in scale items Problem Behaviour scale limited to behavioral concerns related to social interactions

ConclusionThe SSIS-RS is a quick and straightforward rating scale that is used to gather information about a child’s social skills and problem behavior. The design renders it easy to administer and score. However, caution must be used when interpreting the “Special Population” studies due to small sample size. The SSIS-RS is particularly appealing because of the use of a multi-tiered system that links to specific interventions for the child.

ReferencesCrosby, J. W. (2011). Test Review: F. M. Gresham & S. N. Elliott Social Skills Improvement System Rating Scales. Minneapolis, MN: NCS Pearson, 2008. Journal of Psychoeducational Assessment, 29(3), 292-296. doi:10.1177/0734282910385806Doll, B., & Jones, K. (2010). [Review of the Social Skills Improvement Rating Scales.] In The eighteenth mental measurements yearbook. Retrieved from http://web.ebscohost.com.ezproxy.lib.ucalgary.ca/Gresham, F. M. & Elliott, S. N. (2008). Social skills improvement system: Rating scales manual . Minneapolis, MN: NCS Pearson, Inc. Lee-Farmer, J., & Meikamp, J. (2010). [Social Skills Improvement Rating Scales]. In The eighteenth mental measurements yearbook. Retrieved from http://web.ebscohost.com.ezproxy.lib.ucalgary.ca/