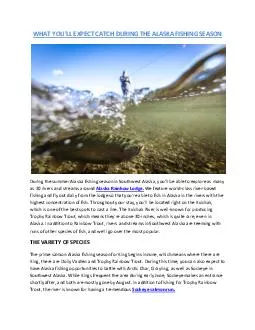
/
3-1GULF OF ALASKA FLATFISH by Benjamin J. Turnock, Thomas K. Wilderbuer and Eric S. Brown 3-1GULF OF ALASKA FLATFISH by Benjamin J. Turnock, Thomas K. Wilderbuer and Eric S. Brown

3-1GULF OF ALASKA FLATFISH by Benjamin J. Turnock, Thomas K. Wilderbuer and Eric S. Brown - PDF document

cheryl-pisano
cheryl-pisano . @cheryl-pisano
Follow
456 views
Uploaded On 2015-07-21

3-1GULF OF ALASKA FLATFISH by Benjamin J. Turnock, Thomas K. Wilderbuer and Eric S. Brown - PPT Presentation

32INTRODUCTION The flatfish species complex has been managed as a unit in the Gulf of Alaska and includes the major flatfish species inhabiting the region with the exception of Pacific halibut Hi ID: 89413

3-2INTRODUCTION The "flatfish" species

Share:

Link:

Embed:

Download Presentation from below link

Download Pdf The PPT/PDF document "3-1GULF OF ALASKA FLATFISH by Benjamin J..." is the property of its rightful owner. Permission is granted to download and print the materials on this web site for personal, non-commercial use only, and to display it on your personal computer provided you do not modify the materials and that you retain all copyright notices contained in the materials. By downloading content from our website, you accept the terms of this agreement.


Presentation Transcript

3-1GULF OF ALASKA FLATFISH by Benjamin J. Turnock, Thomas K. Wilderbuer and Eric S. Brown SUMMARY Catch has been updated through October 15, 2001. The 2001 survey biomass estimates were used to calculate ABC’s for all species except Greenland turbot and deepsea sole, where the mean catch from Catches for species in the deep-water or shallow-water groups were estimated from 1978 to 2001 by multiplying the group catch estimate by the estimate of the fraction of each species in the catch based on observer data. The 2001 Triennial trawl survey biomass was used as current biomass for calculation of ABC. Rock sole ABC was estimated using F40% calculated using the Bering sea rock sole maturity schedule. Greenland turbot and deepsea sole ABC and OFL were calculated using average catch. ABC’s for other flatfish except rock sole were estimated using F = 0.75 M. The 2002 ABC for deep-water flatfish declined to 4,877 t, from the 2001 ABC of 5,300 t. The 2002 ABC for shallow-water flatfish increased to 49,546 t from 37,855 t in 2001, due to increasing survey abundance of some species in the shallow-water flatfish group. The 2002 ABC for flathead sole decreased by about 17% to 22,684 t from 26,264 t in 2001. The 2002 ABC for rex sole at 9,466 t was essentially unchanged from the 2001 ABC of 9,442 t. The flatfish resource was lightly to moderately harvested in 2001 as the shallow-water, deep-water, flathead sole and rex sole ABC apportionments were 19%, 18%, 6%, 38% harvested through October 15, respectively. The 2001 catches were very similar to the 2000 catches. Catches in the deep-water complex declined from 2,285 t in 1999 to 892 t in 2000, then were 985 t through October 15, 2001 (Table 3.3). Shallow-water flatfish catches increased from 2,577 t in 1999 to 6,187 t in 2000, then increased slightly to 6,928 t through October 15, 2001. Flathead sole catches increased from 900 t in 1999 to 1,445 t in 2000, then were 1,547 t through October 15, 2001. Rex sole catches increased slightly from 3,060 t in 1999 to 3,352 t in 2000, then were 3,591 t through October 15, 2001. 3-2INTRODUCTION The "flatfish" species complex has been managed as a unit in the Gulf of Alaska and includes the major flatfish species inhabiting the region with the exception of Pacific halibut (Hippoglossus stenolepis The major species, which account for 98% of the current biomass, are arro stomias ), flathead sole (Hippoglossoides elassodon ), rock sole (Pleuronectes bilineatus ), rex sole (Errex zachirus ), Dover sole (Microstomus pacificus ), yellowfin sole (Pleuronectes asper ), and starry flounder (Platichthys stellatus ). The arrowtooth flounder stock assessment is presented in a separate chapter. The North Pacific Fisheries Management Council divided the flatfish assemblage into four categories for management in 1990; "shallow flatfish" and "deep flatfish" (Table 3.1), flathead sole and arrowtooth flounder. This classification was made because of the significant difference in halibut bycatch rates in directed fisheries targeting on shallow-water and deep-water flatfish species. Arrowtooth flounder, because of its present high abundance and low commercial value, was separated from the group and managed under a separate acceptable biological catch (ABC). Flathead sole were likewise assigned a separate ABC since they overlap thw-water and deep-water groups. In 1993 rex sole was split out of the deep-water management category because of concerns regarding the Pacific ocean perch bycatch in the rex sole target fishery. For this assessment, flatfish biomass, fishing mortality rates, and ABC estimates are presented for each species and management category. Beginning with the 1996 triennial trawl survey, rock sole was split into two species, a northern rock sole (Lepidopsetta sp. cf. bilineata) and a southern rock sole (L. bilineata)(per.comm. Jay Orr). Due to overlapping distributions, differential harvesting of the two species may occur, requiring separate management in the future. This report describes flatfish catches taken from 1978 through October 15, 2001 and presents information on the status of flatfish stocks and their potential yield based on data updated through the 2001 Gulf of Alaska demersal trawl survey. CATCH HISTORY Since the passage of the MFMCA in 1977, the fishery for flatfish in the Gulf of Alaska has undergone changes. Until 1981, annual harvests were around 15,000 t, primarily taken by foreign vessels targeting other species (Table 3.2). Thereafter, catches decreased to a low of 2,441 t in 1986 before increasing to a high of 43,107 t in 1996. Flatfish catches declined to 23,237 t in 1998 and have increased to 37,303 t in 2001. With the cessation of foreign fishing in 1986, joint venture fishing began to account for the majority of the catch. In 1987, the gulf-wide flatfish catch increased nearly fourfold to 9,925 t with the joint venture fisheries accounting for nearly all of the increase (73% of the gulf-wide catch). After 1988, only domestic fleets harvest flatfish. The NPFMC Central Gulf management area has produced the majority of the flatfish catch from the Gulf of Alaska (Table 3.2). Since 1988 the majority of the harvest has occurred on the continental shelf and slope east of Kodiak Island. Although arrowtooth flounder comprised about half the catch, the fishery primarily targeted on rock, rex and Dover sole (Table 3.3). Catch is currently reported for deep-water flatfish, shallow-water flatfish, flathead sole and rex sole by management area (Table 3.3). The catch by species in each year was estimated by using the fraction of each species in their respective group from observer sampling in that year, multiplied by the total catch for that group by gear type and management area (i.e. deep-water or shallow-water group, Tables 3.4 and 3.5). The blend estimate of catch is used as the estimate of total catch. Catches for the deep-water 3-3species were estimated from 1978 to 1995 for estimation of the average catch used in ABC calculations (Table 3.6). Most of the catch in the deep-water group has been Dover sole. However, Greenland turbot catch has been quite variable in recent years, ranging from 3,012 t in 1992 to 13 t in 1997 (Table 3.6). Table 3.7 documents annual research catches (1977 - 1998) from NMFS longline, trawl, and echo integration trawl surveys. The flatfish resource was lightly to moderately harvested in 2001 as the shallow-water, deep-water, flathead sole and rex sole ABC apportionments were 19%, 18%, 6%, 38% harvested through October 15, respectively. The 2001 catches were very similar to the 2000 catches. The 2001 deep-water flatfish fishery was closed on May 25, July 23, and October 16 to prevent exceeding the halibut bycatch limit. The entire GOA was closed to trawling for flatfish on October 21 due to reaching the halibut bycatch limit. The 2001 shallow-water flatfish fishery was open from Jan. 10 to April 27, May 21-May 26, June 10-June 27, July 1-August 4, September 1-September 5. All closures were due to the attainment of the halibut bycatch limit. The shallow-water flatfish fishery was then closed for the rest of the year on October 21 due to reaching the halibut bycatch limit. Catches in the deep-water complex declined from 2,285 t in 1999 to 892 t in 2000, then 985 t through October 15, 2001 (Table 3.3). Shallow-water flatfish catches increased from 2,577 t in 1999 to 6,187 t in 2000, then increased slightly to 6,928 t through October 15, 2001. Flathead sole catches increased from 900 t in 1999 to 1,445 t in 2000, then were 1,547 t through October 15, 2001. Rex sole catches increased from 3,060 t in 1999 to 3,352 t in 2000, then were 3,591 t through October 15, 2001. The flatfish fishery is likely to continue to be limited by the potential for high by-catches of Pacific halibut. Estimates of retained and discarded catch (t) in the various trawl target fisheries, since 1991, by management assemblage, were calculated from discard rates observed from at-sea sampling and industry reported retained catch (Table 3.8). Flatfish retention ranged from 73% for deep-water flatfish to 97% for rex sole in the 2000 fishery. CONDITION OF STOCKS Survey Abundance The principal source of information for evaluating the condition of flatfish stocks in the Gulf of Alaska is the triennial bottom trawl survey conducted from 1984 to 2001 (Table 3.9 and Figure 3.1). Flatfish biomass estimates from the 2001 survey by INPFC area are given in Table 3.10. Sampling for the 2001 survey was conducted in the western and central portions of the gulf only. Biomass for the eastern gulf was approximated using the average of the 1993 to 1996 eastern gulf biomass estimates. The apportionment of survey sampling stations on the shelf and slope followed the methods developed for the shelf portion of the 1984 survey (Brown 1986). There was no sampling deeper than 500 meters during 1990 to 1996, and 2001 because of limited vessel time. The 500- 1,000 m depths sampled in 1984 and 1987, and 1999 are generally outside the depth range of most flatfish species with the exception of Dover sole, Greenland turbot, deep-sea sole and, to a lesser extent, Rex sole. Many flatfish species have an increasing trend in biomass in the 1980’s and then a decreasing trend in the 1990’s. Survey biomass has declined for Dover sole from 96,602 t in 1990 to 68,211 t in 2001. Northern rock sole declined from 78,931 t in 1996 to 64,240 t in 2001. Southern rock sole also declined from 127,306 t in 1996 to 105,522 t in 1999, then increased to 126,057 t in 2001. Flathead sole declined from 247,247 t in 1990 to 170,915 t in 2001. Rex sole declined from 95,630 t in 1990 to 71,326 t in 2001. Yellowfin sole declined from 84,002 t in 1993 to 48,309 t in 1999, then increased slightly to 55,303 t in 2001. Butter sole has steadily declined from 31,366 t in 1993 to 9,812 t in 2001. Starry flounder biomass has increased from 10,907 t in 1990 to 46,653 t in 1999 and continued to increase to 76,418 t in 3-42001. English sole increased in abundance from 6,897 t in 1993 to 14,433 t in 1999, then remained steady at 14,166 t in 2001. Alaska plaice has also increased in abundance from 2,709 t in 1993 to 8,680 t in 1999, then declined to 3,639 t in 2001. Sand sole has declined in abundance from 970 t in 1996 to 234 Current Exploitable Biomass With the exception of Greenland turbot and deep-sea sole, the best available estimate of current exploitable biomass is assumed to be the same as the survey biomass from 2001 because the non-exploitable () component of the survey biomass is small and the survey bottom trawl (90 x 105 ft. roller gear) is only partially selected for non-exploitable sizes. Recent experimental evidence suggests that flatfish biomass estimates derived from the noreastern trawl used in the survey may underestimate true biomass because the escapement portion of the catchability assumption may be large (Weinberg, in review). Experiments are being conducted to estimate the herding component of catchability, which may offset some of the escapement. BIOLOGICAL PARAMETERS Natural mortality, Age of recruitment, and Maximum Age Natural mortality rates for Gulf of Alaska flatfish species were estimated using the methods of Alverson and Carney (1975), Pauly (1980), and Hoenig (1983) in the 1988 assessment (Wilderbuer and Brown 1989). The estimates were different for each method and were not inconsistent with the value of 0.2, used in previous assessments (Wilderbuer and Brown 1989). A natural mortality value of 0.2 was used for all flatfish except Dover sole (Table 3.11). Natural mortality for Dover sole was assumed to be 0.10, the same as West Coast Dover sole because maximum age is about 45 years (Turnock, et al 1994). Length and Weight at Age Values for the parameters in the Von Bertalanffy age-length relationship were estimated from age structures collected during the trawl surveys (Table 3.12). Length composition data from the triennial surveys are shown in Figure 3.2. Aging of Gulf of Alaska flatfish species has been sporadic since the inception of the triennial surveys. Estimates of survey age compositions for flatfish are shown in Figure The parameters calculated for the length (cm) - weight (g) relationship: W = a * L (both sexes combined) are shown below. Species a B Flathead sole 0.004056 3.2374 Rock sole 0.009984 3.0468 Yellowfin sole 0.006678 3.1793 Rex sole 0.004459 3.4710 3-5Maturity at Age At the present time information to estimate maturity of flatfish species in the Gulf of Alaska is available only for arrowtooth flounder. Maturity data for northern and southern rock sole is still being analyzed. In this assessment, the rock sole maturity information for the Bering Sea will be used for the Gulf of Alaska rock sole because growth appears to be very similar for the two areas (Table 3.13). However, the size at age for other species in the Gulf of Alaska is quite different from the Bering Sea and so maturity information from the Bering sea may not be applicable. Flatfish consume a variety of benthic organisms (Table 3.14; Livingston and Goiney 1983, Yang 1990). Fish prey make up a large part of the diet of flathead sole and rock sole adults and possibly sand sole (although the sample size was small for sand sole). Other flatfishes consume mostly polychaetes, crustaceans and mollusks. ACCEPTABLE BIOLOGICAL CATCH Rock sole are in tier 4 of the ABC and overfishing (OFL) definitions, where FABC = F and FOFL = Rock sole was estimated to be approximately fully selected in the survey at about age 7 by visual examination of size compositions from the fishery and applying the growth curve. Selectivities were applied as knife-edge at age 7 for calculation of FABCs for all flatfish, except rock sole, deep-sea sole and Greenland turbot, were calculated using FABC = OFL = M (tier 5), since maturity information was not available. Natural mortality was assumed to be 0.2 for butter sole, starry flounder, English sole, Alaska plaice, and sand sole. Greenland turbot and deep-sea sole are in tier 6 since there are no reliable biomass estimates, where ABC = 0.75 OFL and OFL = the average catch from 1978 to 1995 (Table 3.6). Recommended fishing mortality rates for 2001 ABCs are as follows: Species FABC FOFL Flathead sole 0.15 0.2 Rock sole 0.17 0.209 Yellowfin sole 0.15 0.2 Rex sole 0.15 0.2 Dover sole 0.075 0.1 All other flatfish (except Greenland turbot and deep-sea sole) The flatfish complex ABCs for the 2001 fishing season were calculated using the catch equation, the ABC fishing mortality rate, and the 2001 survey biomass estimate for each species, (Table 3.15) except for Greenland turbot and deep-sea sole where average catch was used. Overfishing values and yield are presented in Table 3.16. The 2002 ABC for deep-water flatfish declined to 4,877 t, from the 2001 ABC of 5,300 t. The 2002 ABC for shallow-water flatfish increased to 49,546 t from 37,855 t in 2001, due to increasing abundance of some species of the shallow-water flatfish group. The 2002 ABC for flathead sole decreased by about 17% to 22,684 t from 26,264 t in 2001. The 2002 ABC for rex sole at 9,466 t was essentially unchanged from the 2001 ABC of 9,442 t. 3-6Due to the overlapping distributions of flatfish species, especially in the shallow-water group, it may be difficult to target a species within an arbitrary management group without impacting other flatfish species in that group or other species which were "split-out" and managed separately. Given the present management strategy used by the North Pacific Fishery Management Council for Gulf of Alaska flatfish, some species may be subjected to higher fishing mortalities than that resulting from the recommended ABCs. Even the most abundant species of the shallow-water category, rock sole, could be over-harvested given the present species grouping because the harvest level for a management group is based on the composite biomass of several species. BIOMASS PROJECTIONS The exploitable biomass in the year 2002 is projected using the delay difference equation of Deriso (1980). This model incorporates growth, natural mortality, recruitment, and two years of biomass estimates (1999 and 2001 trawl surveys) to predict future biomass (Table 3.17). Exploitable biomass is predicted under harvest strategies of FABCOFLand F=0. Recruitment biomass is assumed to be constant during the projected years and was approximated from the 1999 Gulf of Alaska trawl survey biomass due to the lack of data in the eastern gulf for the 2001 survey. The recruitment estimates were as follows: Rock sole fish less than 25 cm 5,190 t Flathead sole fish less than 28 cm 15,226 t Yellowfin sole fish less than 25 cm 1,102 t Rex sole fish less than 25 cm 5,255 t Dover sole fish less than 30 cm 1,351 t REFERENCES Alverson, D., and M. Carney. 1975. A graphic review of the growth and decay of population cohorts. Const. Int. Explor. Mer, 36(2): 133-143. Brown, E. S. 1986. Preliminary results of the 1984 U.S.-Japan cooperative bottom trawl survey of the central and western Gulf of Alaska. In R.L. Major (editor), Condition of groundfish resources of the Gulf of Alaska as assessed in 1985, p. 259. U.S. Dep. Commer., NOAA Tech. Memo. NMFS F/NWC-Deriso, R. B. 1980. Harvesting strategies and parameter estimation for an age-structured model. Can. J. Fish. Aquat. Sci. 37: 268-282. Hoenig, J. 1983. Empirical use of longevity data to estimate mortality rates. Fish. Bull. 82: 898-903. Livingston, P., and B. Goiney. 1983. Food habits literature of north pacific marine fishes: A review and selected bibliography. NOAA tech. Mem. NMFS F/NWC-54. Murai, S., H. A. Gangmark, and R. R. French. 1981. All-nation removals of groundfish, Herring, and shrimp from the eastern Bering Sea and northeast Pacific Ocean, 1964-80. NWAFC report. 40 p. Pauly, D. 1980. On the interrelationships between natural mortality, growth parameters, and mean environmental temperature in 175 fish stocks. J. Cons. Int. Explor. Mer, 39:175-192. 3-7Turnock, B.J., Turnock, J., M. Wilkins, M. Saelens west coast Dover sole in 1994. Status of the Pacific coast groundfish fishery through 1994 and recommended acceptable biological catches for 1995. Pacific Fishery Management Council, Portland, Oregon. Weinberg, K. In Review. Estimation of escapement under bottom trawls from camera observations. Fish Bulletin. Wilderbuer, T. K., and E. S. Brown. 1989. Flatfish. In T. K. Wilderbuer (editor), Condition of groundfish resources of the Gulf of Alaska as assessed in 1988. p. 199-218. U. S. Dep. Commer., NOAA Tech. Memo, NMFS F/NWC-165. Yang, M. S. 1993. Food habits of the commercially important groundfishes in the Gulf of Alaska in 1990. U.S. Dept. Commer., NOAA Tech. Memo. NMFS-AFSC-22, 150 p. 3-8Table 3.1. Flatfish constituents of the 1996 NPFMC Gulf of Alaska deep-water and shallow-water management categories. Category Common name Genus and Species Deep-water Dover sole Microstomus pacificus Greenland turbot Reinhardtius hippoglossoides Deep-sea sole Embassichthys bathybius Shallow-water Northern rock sole Lepidopsetta perarcuata Southern rock sole Pleuronectes bilineatus Yellowfin sole Pleuronectes asper Starry flounder Platichthys stellatus Butter sole Pleuronectes isolepis English sole Pleuronectes vetulus Alaska quadrituberculatus Sand sole Psettichthys melanostictus 3-9Fishery category Western CentralEasternTotal Foreign 1978 2,538 6,3125,49114,341 1979 2,817 5,0265,63113,474 1980 3,022 6,8855,59015,497 1981 3,224 5,7595,46114,444 1982 1,412 7,516588,986 1983 2,020 7,459519,530 1984 603 2,43003,033 1985 115 550170 1986a 56 15071 1978 5 005 1979 7 62170 1980 11 1980209 1981 0 18018 1982 6 12018 1983 171 2,52102,692 1984 566 2,88203,448 1985 324 2,12302,447 1986 302 6590961 1987 2,073 5,13407,207 1988b tr 1,78001,781 1978 6 86760852 1979 0 55329384 1980 0 4694140 1981 0 77327404 1982 0 71203274 1983 0 88351439 1984 5 246181432 1985 10 254197461 1986 362 7742731,409 1987 184 2,0015332,718 1988 810 7,2234618,494 Total 1978 2,549 6,3986,25115,198 1979 2,824 5,1435,96113,928 1980 3,033 7,1295,68415,846 1981 3,224 5,8545,78814,866 1982 1,418 7,5992619,278 1983 2,191 10,06840212,661 1984 1,174 5,5581816,913 1985 449 2,4321973,078 1986 720 1,4482732,441 1987 2,257 7,1355339,925 1988 811 9,00346110,275 1989c 142 4,8881875,167 1990 2,272 12,96917015,411 1991 3,195 16,65721620,068 1992 3,007 27,88196831,939 1993 3,119 33,7001,03637,853 1994 1,962 34,1912,39138,544 1995 2,658 28,1821,43332,273 1996 3,826 37,9421,33943,107 1997 4,179 26,8642,45533,498 4,284 18,33961423,237 4,761 19,1431,12525,029 7,565 26,77052234,857 7,917 28,74963737,303 3-10Table 3.3. Composition of the 1994 to October 15, 2001 Gulf of Alaska flatfish catch by management category and North Pacific Fishery Management Council regulatory area. Area WesternCentralEasternTotal Percent total Shallow-water 1893,742123,943 11Deep-water 212,8362723,129 8Flathead sole 4992,067142,580 7Arrowtooth flounder 1,18621,40896623,560 64Rex sole 493,540843,673 10 Shallow-water 3665,05775,430 17Deep-water 961,8952222,213 7Flathead sole 5891,563292,181 7Arrowtooth flounder 1,38716,0401,00118,428 57Rex sole 2203,6271744,021 12 Shallow-water 4438,876319,350 22Deep-water 191,9542202,193 5Flathead sole 8402,1641033,107 7Arrowtooth flounder 2,02019,76879522,583 52Rex sole 5045,1801905,874 14 Shallow-water 4007,328477,775 23Deep-water 132,6441,0073,664 11Flathead sole 4491,938592,446 7Arrowtooth flounder 2,63612,5181,16516,319 49Rex sole 6812,4361773,294 10 Shallow-water 2703,204913,565 15Deep-water 162,182882,286 10Flathead sole 5661,16881,742 7Arrowtooth flounder 2,9939,59039212,975 56Rex sole 4392,195352,669 11 Shallow-water 2682,298112,577 10Deep- water 221,8653982,285 9Flathead sole 18668727900 4Arrowtooth flounder 3,68111,90062616,207 65Rex sole 6042,393633,060 12 Shallow-water 5625,61876,187 18Deep-water 24731137892 3Flathead sole 2191,216101,445 4Arrowtooth flounder 5,92616,69136422,981 66Rex sole 8342,51443,352 10 3-11Table 3.3, continued. Composition of the 1994 to October 15, 2001 Gulf of Alaska flatfish catch by management category and North Pacific Fishery Management Council regulatory area. Shallow-water 5606,319496,928 Deep-water 27816142985 Flathead sole 2581,274151,547 Arrowtooth flounder 6,18817,63942524,252 Rex sole 8842,70163,591 3-12Table 3.4. Estimated catch of species in the shallow-water flatfish group by area for 1991 to October 15, Shallo -water flatfish y ea Wester n CentralEaster n Total Rocksole 91 2188 21080429692 2440 47660720693 407 75800798794 180 225111244295 332 38454418196 423 57520617597 313 56111592498 7 209552215499 180 16402182300 512 3984745032001 139 465604795Alaska 91 5 11792 2 30593 1 40594 0 10195 1 60796 1 6406597 5 4605198 0 1811999 3 20500 1 110122001 11 16027 lish sole 91 2 7107392 1 4704893 6 7708394 4 4204695 3 4204596 5 822911697 16 704513198 122 35115899 1 1401500 1 630642001 4 59063Butter sole 91 8 562057092 15 13510136693 8 14290143794 0 10570105795 23 894091796 2 23510235397 15 979099498 39 4881554299 0 420942900 0 1123011232001 0 9060906 3-13Table 3.4 Continued. Estimated catch of species in the shallow-water flatfish group by area for 1991 to Western Central Eastern Total Sand sole 91 0 2802892 0 10193 0 1201294 0 00095 0 10196 0 1901997 1 7907998 0 168016899 0 70700 5 260312001 2 002Yellowfin sole 91 4 5105592 6 5105793 2 3503794 4 148015295 5 6006596 12 5506797 42 156019898 0 1212014199 81 1009100 21 380592001 373 68101054Starry flounder 91 16 253026992 6 94010093 0 154015494 1 9109295 1 179018096 0 576157797 9 390140198 102 279138299 2 205020700 21 37403952001 31 0031 3-14Table 3.5. Estimated catch by species and area for the deep-water flatfish from 1991 to October 15, WesternCentralEasternTotal Greenland turbot 91 430160446 233147813013012 93 133016 94 134017 95 81175103 96 113115 97 93113 98 66672 99 105621 00 22124 2001 111012 Dover sole 91 75188721189741 1068165928364 93 933653593804 94 827772683053 95 1518771892082 96 819512192178 97 4264910073659 98 162138202174 99 1218603922263 00 2729136867 2001 16812142870 Deep-sea sole 91 0.11.501.6 92 0.22.302.5 93 03.103.1 94 03.30.63.9 95 01.30.11.4 96 00.400.4 97 0101 98 0.038.11.839.9 99 0111 00 0101 2001 0303 Catch of Greenland turbot in the blend database was used for 1992 because estimated catch was lower Catch of Dover sole in 1992 estimated by subtracting Greenland turbot from the deep-water flatfish 3-15Table 3.6. Dover sole, Greenland turbot and deep-sea sole catch 1978 to October 15, 2001. Average catch for Greenland turbot for 1978 to 1995 = 238 mt. Average catch for Dover sole for 1978 to 1995 = 1,969 mt. Average catch for Deepsea sole for 1978 to 1995 = 6.0 mt. Year Greenland turbotDover soledeep-sea sole 1978 518274.9 1979 245305.11980 575702.21981 84578.31982 2345730.51983 14535411.11984 181320.81985 433.21986 2301987 445601988 256108701989 56152101990 234829.61991 44697411.61992 301283642.51993 1638043.11994 1730533.91995 10320821.41996 1521780.41997 13365911998 72217439.91999 2122632000 2486712001 128703 3-16Table 3.7. Catch(mt) from longline and Year Dover turbot deepsea Total Rock N. Rock S. Rock Yellowfin ButterStarry English Sand Alaska plaice Flathead Rex 1977 1.12 0.00 0.00 4.26 0.000.001.170.220.120.04 0.00 0.0110.321.97 1978 5.99 0.30 0.00 44.72 0.000.003.762.611.851.74 3.69 0.3923.658.47 1979 5.04 0.00 0.00 0.96 0.000.000.000.060.000.02 0.00 0.005.4712.60 1980 0.92 0.04 0.00 15.83 0.000.008.982.700.980.31 0.31 0.4829.704.64 1981 15.80 0.08 0.01 30.84 0.000.0010.915.051.860.53 0.24 0.7549.4717.23 1982 5.71 0.03 0.00 26.15 0.000.002.483.451.070.64 0.16 0.1920.077.73 1983 7.71 0.14 0.00 3.32 0.000.001.670.300.020.02 0.00 0.0319.997.21 1984 15.79 0.18 0.01 19.10 0.000.009.081.880.970.39 0.09 0.1739.3318.27 1985 17.58 0.17 0.00 3.22 0.000.000.050.230.020.14 0.00 0.0317.4614.05 1986 1.25 46.79 0.00 4.18 0.000.004.090.080.030.13 0.00 0.0341.423.74 1987 16.16 0.09 0.01 24.56 0.000.006.851.431.520.87 0.00 0.5337.5821.12 1988 0.06 0.01 0.00 0.37 0.000.002.560.000.010.00 0.00 0.032.700.08 1989 1.90 0.02 0.00 1.12 0.000.001.780.070.130.00 0.00 0.258.871.77 1990 11.65 0.02 0.00 11.13 0.000.002.840.940.440.31 0.01 0.3022.5011.99 1991 0.02 0.01 0.00 0.00 0.000.000.000.000.000.00 0.00 0.000.120.01 1992 0.97 0.04 0.00 0.00 0.000.000.000.000.000.00 0.00 0.000.360.04 1993 14.80 0.03 0.00 16.53 0.000.007.262.173.190.59 0.04 0.2627.3612.68 1994 0.06 0.07 0.00 0.00 0.000.000.000.000.000.00 0.00 0.000.050.03 1995 0.00 0.01 0.00 0.00 0.000.000.000.000.000.00 0.00 0.000.030.00 1996 7.39 0.04 0.00 0.44 5.087.063.670.960.940.37 0.05 0.3514.467.04 1997 0.01 0.03 0.00 0.00 0.000.000.000.000.000.00 0.00 0.000.010.00 1998 5.00 0.00 0.00 0.00 0.000.000.000.000.000.01 0.00 0.001.584.09 Table 3.8. Percent retained catch for the Gulf of Alaska flatfish fisheries. Species 1991 1992 199319941995199619971998 19992000 Flathead sole 59 66 666771778383 6283 deep-water flatfish* 907579728290 8073 shallow-water flatfish 827371868183 7788 rex sole 8990959297 9697 *Includes rex sole from 1991-93. 3-17Table 3.9. Biomass estimates from the triennial trawl survey from 1984 to 2001. In 1984, 1987 and 1999 depths surveyed were to 1000 meters. In 1990, 1993 and 1996 depths were surveyed to 500 meters. 1984 19871990199319961999 2001 Deep-water flatfish Dover sole 68,525 63,39796,60285,42779,53574,367 68,211 Greenland turbot 292 1430000 0 Deep-sea sole 218 16000097 52 Shallow-water Rock sole total 137,472 123,221159,452182,991206,237166,604 190,297 Northern rock sole - ---78,93161,082 64,240 Southern rock sole - ---127,306105,522 126,057 Yellowfin sole 91,341 56,13561,29084,00248,17048,309 55,303 Butter sole 22,504 19,27317,30731,36621,04114,188 9,812 Starry flounder 14,293 14,14110,90744,16727,35046,653 76,418 English sole 3,202 7,243-9,8416,89714,433 14,166 Sand sole 1,216 82-515970234 357 Alaska plaice 1,912 4,830-2,7094,9258,680 3,639 Flathead sole 249,335 179,821247,247198,469206,336207,520 170,915 Rex sole 60,670 63,82795,63089,66572,33374,605 71,326 Table 3.10. Biomass estimates (t) for Gulf of Alaska flatfish, based on the 2001 bottom trawl survey, by North Pacific Fishery Management Council regulatory area and species. Area Species Western Central Eastern Total Deep-water flatfish Dover sole 89631,63935,67668,211 Greenland turbot 0000 Deep-sea sole 052052 Shallow-water Rock sole total 96,17889,2644,855190,297 Northern rock sole 36,98727,2371664,240 Southern rock sole 59,19162,0274,839126,057 Yellowfin sole 49,5865,61210555,303 Butter sole 3,3385,5788969,812 Starry flounder 14,29157,4694,65876,418 English sole 893,27410,80314,166 Sand sole 4323282357 Alaska plaice 2,1161,52303,639 Flathead sole 67,78785,96117,167170,915 Rex sole 9,62441,72319,97971,326 3-18Table 3.11. Estimates of natural mortality, growth (von Bertalanffy k), and age of recruitment for the major Gulf of Alaska flatfish species. Natural Age at Species mortality Growth recruitment Rock sole 0.20 0.21 7 Dover sole 0.10 -- 13 Estimates are assumed the same as West Coast Dover sole (Turnock, et al 1994) Table 3.12. Von Bertalanffy parameter estimates for prin the Gulf of Alaska. inf (cm) K t 0 Flathead sole 1979 Kodiakmales 27.3 0.58 0.12 females 32.5 0.39 -0.36 combined 29.9 0.49 -0.24 Rock sole 1987 survey males 31.7 0.36 0.73 females 41.6 0.21 0.38 combined 38.8 0.21 0.02 Yellowfin sole 1987 survey males 32.8 0.19 -2.24 females 38.2 0.14 -2.18 combined 34.0 0.18 -1.82 Rex sole 1990 survey males 50.4 0.27 0.58 females 58.1 0.22 -0.47 combined 59.5 0.20 0.37 Rose 1981, MS Thesis 3-19Table 3.13. Maturity schedule (proportion females mature at age) for Bering Sea rock sole used for ABC calculations of Gulf of Alaska rock sole. Age Fraction mature Table 3.14. Food habits of flatfish. Percent observed stomach contents in parentheses where available (Livingston and Goiney, 1983). Fish species observed stomach contents Rex sole polychaetes,snow crabs, euphausiids, pandalus sp. Flathead sole various fishes(38%), mysids(36%), shrimp(15%), clams(6%), polychaetes(3%) rock sole-adults fish(40%) polychaetes(27%), clam siphons(10%) rock sole-juveniles fish(10%), polychaetes(45%), clam siphons(15%), gammarids(8%) yellowfin sole polychaetes, shrimp, fish, tanner crab, clam siphons Dover sole polychaetes(64%),crustaceans(11%),mollusks(18%), echinoderms(3%), coelenterates(3%) English sole polychaetes, ophiuroidea, ophiura sarsi, amphipoda, bivalves sand sole fish with a high frequency of arrowtooth flounder(only 4 stomachs out of 10 with food) starry flounder echiuroidea(starfish), ophiuroidea(brittle star), fish, shrimp, crabs butter sole polychaetes, ophiuroidea, crustacea, shrimp, snow crab, fish 3-20Table 3.15. Acceptable biological catch (t) for 2001 Gulf of Alaska flatfish, based on biomass estimates from the 2001 bottom trawl survey and FABC. Presented by North Pacific Fishery Management Council regulatory area. Split to Western, Central and Eastern management areas estimated by applying the average fraction of the catch in each area from 1991 to 1995. The split of the eastern management area into East Yakutat and West Yakutat/SE was calculated by using the 1999 survey biomass estimate. Area WesternCentralWest YakutatEast Yakutat/SE Total Deep-water flatfish Dover sole 622,1771,3161,138 4,693 1224098 179Deep-sea sole 0.14.20.10.1 4.5Total 1842,2211,3261,146 4,877 Shallow-water flatfish Northern Rock sole 5,5104,05800 9,571Southern Rock sole 8,8189,241290431 18,780Total Rock sole 14,32913,299291432 28,351 Yellowfin sole 6,58174558 7,340Butter sole 74053661,302 1,796Starry flounder 1,8977,627250369 10,142English sole 12435578856 1,880314747 30Alaska plaice 28120200 483 Total 23,54823,0791,1811,738 49,546 Flathead sole 8,99711,4091,591687 22,684 Rex sole 1,2775,5371,5991,053 9,466 0.75 * Average catch used to calculate ABC level. 3-21Table 3.16. Overfishing values (t) for 2001 for Gulf of Alaska flatfish, based on biomass estimates from the 2001 bottom trawl survey and FOFLSpecies Yield(t) Deep-water flatfish Dover sole 6,182 238 Deep-sea sole Total 6,426 Shallow-water flatfish Northern rock sole 11,550 Southern rock sole 22,664 Total rock sole 34,214 Yellowfin sole 9,556 Butter sole 1,695 Starry flounder 13,204 English sole 2,448 Sand sole 62 Alaska plaice 629 Total 61,807 Flathead sole 29,532 Rex sole 12,324 Average catch used to calculate overfishing level. 3-22Table 3.17. Projections to beginning of year 2003 for exploitable biomass and yield using F=0, FABCOFL taken in year 2002ABCis 0.15 for flathead, rex and yellowfin sole, 0.17 for rock sole and 0.075 for Dover sole. FOFLis 0.2 for flathead, rex and yellowfin sole, 0.209 for rock sole and 0.1 for Dover sole. F total biomass (t) Yield Flathead 0 155,6330 ABC 137,86319,689 OFL 132,48825,644rock sole 0 209,6870 ABC 180,62928,646 OFL 174,60934,581rex sole 0 74,9060 ABC 66,0908,922 OFL 63,42411,621yellowfin sole 0 59,9530 ABC 52,5057,362 OFL 50,2529,588Dover sole 0 61,3800 ABC 57,2504,384 OFL 55,9395,775 3-23Figure 3.1. NMFS survey biomass estimates by species for 1984 to 2001. Dover20,00040,00060,00080,000100,000120,00019821984198619881990199219941996199820002002 50,000100,000150,000200,000250,00019821984198619881990199219941996199820002002 Rock sole Northern rock sole Southern rock sole Flathead sole50,000100,000150,000200,000250,000300,00019821984198619881990199219941996199820002002 Rex sole198019851990199520002005 Yellowfin sole198019851990199520002005 3-24 Rock Sole1984 size composition20000000400000006000000012151821242730333639424548515457Length (cm) 1987 size composition5000000100000001500000020000000250000003000000012151821242730333639424548515457Length (cm) 1990 size composition50000001000000015000000200000002500000012151821242730333639424548515457Length (cm) 1993 size composition10000000200000003000000012151821242730333639424548515457Length (cm) 1987 size composition50000001000000015000000200000009131721252933374145495357Length (cm) Rex Sole 1984 size composition500000010000000150000009131721252933374145495357Length (cm) 1990 size composition50000001000000015000000200000009131721252933374145495357Length (cm) 1993 size composition50000001000000015000000200000009131721252933374145495357Length (cm) Figure 3.2. Population size composition of the six major flatfish species estimated from triennial trawl surveys conducted from 1984-2001. 1996 size composition10000000200000003000000012151821242730333639424548515457Length (cm) 1996 size composition500000010000000150000009131721252933374145495357Length (cm) 200000040000006000000800000010000000120000001400000091929394959 199950000001000000015000000200000001222324252Length (cm) 2001 rex sole010203040506070Length (cm) 010203040506070Length (cm) 3-25no length data 1999 Yellowfin Sole 1984 size composition1000000020000000300000004000000010131619222528313437404346Length (cm) 1987 size composition500000010000000150000002000000010131619222528313437404346Length (cm) 1990 size composition10000000200000003000000010131619222528313437404346Length (cm) 1993 size composition10000000200000003000000010131619222528313437404346Length (cm) Flathead Sole 1984 size composition20000000400000006000000080000000100000000591317212529333741454953Length (cm) 1987 size composition50000000100000000150000000591317212529333741454953Length (cm) 1990 size composition20000000400000006000000080000000591317212529333741454953Length (cm) 1993 size composition200000004000000060000000591317212529333741454953Length (cm) Figure 3.2. Continued. Population size composition of the five major flatfish species estimated from the triennial trawl surveys conducted from 1984-2001. 1996 size composition5000000100000001500000010131619222528313437404346Length (cm) 1996 size composition200000004000000060000000591317212529333741454953Length (cm) 1999 survey50000001000000015000000200000002500000030000000350000004000000045000000500000005101520253035404550Length (cm) 500000010000000150000000102030405060Length (cm) 0102030405060Length (cm) 3-26Figure 3.2. Continued. Population size composition of the five major flatfish species estimated from the triennial trawl surveys conducted from 1984-2001. Dover sole 1984 size composition2000000400000060000008000000100000001519232731353943475155596367Length (cm) 1987 size composition500000010000000150000001519232731353943475155596367Length (cm) 1990 size composition2000000400000060000008000000100000001519232731353943475155596367Length (cm) 1993 size composition5000000100000001519232731353943475155596367Length (cm) 1996 size composition20000004000000600000080000001519232731353943475155596367Length (cm) 19991000000200000030000004000000500000060000007000000152535455565Length (cm) 152535455565Length (cm) 3-27 1984 flathead sole age composition357911AgeProportio 1984 rock sole age composition36912151821AgeProportio 1993 rex sole age composition3579111315AgeProportio 1990 rex sole age composition34567891011AgeProportio Yellowfin sole 1987 size composition0.020.040.060.080.10.120.14468101214161820AgeProportio 1984 arrowtooth flounder age composition3579111315AgeProportio Figure 3.3. Flatfish age compositions from NMFS surveys.