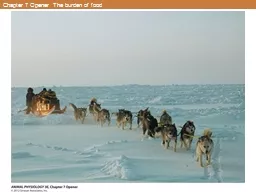
/
Chapter 7 Opener  The burden of food Chapter 7 Opener  The burden of food

Chapter 7 Opener The burden of food - PowerPoint Presentation

conchita-marotz
conchita-marotz . @conchita-marotz
Follow
342 views
Uploaded On 2018-10-25

Chapter 7 Opener The burden of food - PPT Presentation

Figure 71 The second law of thermodynamics in action Figure 71 The second law of thermodynamics in action Figure 72 The uses of energy by an animal Figure 72 The uses of energy by an animal ID: 696743

weight figure metabolic body figure weight body metabolic function rate table size specific mammals energy related bmr box species

Share:

Link:

Embed:

Download Presentation from below link

Download Presentation The PPT/PDF document "Chapter 7 Opener The burden of food" is the property of its rightful owner. Permission is granted to download and print the materials on this web site for personal, non-commercial use only, and to display it on your personal computer provided you do not modify the materials and that you retain all copyright notices contained in the materials. By downloading content from our website, you accept the terms of this agreement.


Presentation Transcript

Slide1

Chapter 7 Opener The burden of food Slide2

Figure 7.1 The second law of thermodynamics in action Slide3

Figure 7.1 The second law of thermodynamics in action Slide4

Figure 7.2 The uses of energy by an animalSlide5

Figure 7.2 The uses of energy by an animalSlide6

Figure 7.3 In this type of external work, some of the energy driving locomotion is converted to potential energy of position Slide7

Box 7.2 Units of Measure for Energy and Metabolic RatesSlide8

Figure 7.4 Lavoisier’s direct calorimeterSlide9

Figure 7.4 Lavoisier’s direct calorimeterSlide10

Box Extension 7.4ASlide11

Box Extension 7.4BSlide12

Figure 7.5 Specific dynamic action (SDA)Slide13

Figure 7.5 Specific dynamic action (SDA)Slide14

Figure 7.6 The effect of body size on weekly food requirements Slide15

Figure 7.6 The effect of body size on weekly food requirements Slide16

Figure 7.7 BMR as a function of body weight in various species of placental mammalsSlide17

Figure 7.7 BMR as a function of body weight in various species of placental mammalsSlide18

Figure 7.8 Weight-specific BMR as a function of body weight in various species of placental mammalsSlide19

Figure 7.8 Weight-specific BMR as a function of body weight in various species of placental mammalsSlide20

Figure 7.9 Weight-specific metabolic rate as a function of body weight in four groups of vertebratesSlide21

Figure 7.9 Weight-specific metabolic rate as a function of body weight in four groups of vertebratesSlide22

Figure 7.10 Metabolic rate and body weight are related linearly on log–log coordinatesSlide23

Figure 7.10 Metabolic rate and body weight are related linearly on log–log coordinatesSlide24

Figure 7.10 Metabolic rate and body weight are related linearly on log–log

coordinates (Part 1)Slide25

Figure 7.10 Metabolic rate and body weight are related linearly on log–log

coordinates (Part 2)Slide26

Figure 7.11 Hearts of a horse, cat, and mouse: Heart size in mammals is roughly proportional to body sizeSlide27

Box 7.5 Scaling of Heart FunctionSlide28

Figure 7.12 Herbivores of different body sizes coexisting on an African grasslandSlide29

Figure 7.13 As the circulatory system is scaled up and down in size and extent, constraints predicated on fractal geometry may help give rise to allometric metabolic scalingSlide30

Figure 7.13 As the circulatory system is scaled up and down in size and extent, constraints predicated on fractal geometry may help give rise to allometric metabolic scalingSlide31

Figure 7.14 Net growth efficiency during each year of life in Pacific sardines (

Sardinops

sagax

)Slide32

Figure 7.14 Net growth efficiency during each year of life in Pacific sardines (

Sardinops

sagax

)Slide33

Table 7.1Slide34

Table 7.2Slide35

Table

7.3 (Part 1)Slide36

Table

7.3 (Part 2)Slide37

Table 7.4Slide38

Table 7.5