/
Using CLIPS to Detect Network Intrusions - (CLIPNIDS) Using CLIPS to Detect Network Intrusions - (CLIPNIDS)

Using CLIPS to Detect Network Intrusions - (CLIPNIDS) - PowerPoint Presentation

conchita-marotz
conchita-marotz . @conchita-marotz
Follow
436 views
Uploaded On 2016-05-16

Using CLIPS to Detect Network Intrusions - (CLIPNIDS) - PPT Presentation

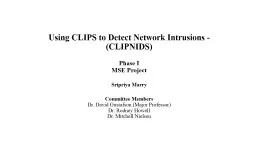
Phase I MSE Project Sripriya Marry Committee Members Dr David Gustafson Major Professor Dr Rodney Howell Dr Mitchell Nielsen Overview Problem Statement Purpose and Motivation Background ID: 321909

network clipnids effort project clipnids network project effort latest phase snort based ids required detection time estimation intrusions cost

Share:

Link:

Embed:

Download Presentation from below link

Download Presentation The PPT/PDF document "Using CLIPS to Detect Network Intrusions..." is the property of its rightful owner. Permission is granted to download and print the materials on this web site for personal, non-commercial use only, and to display it on your personal computer provided you do not modify the materials and that you retain all copyright notices contained in the materials. By downloading content from our website, you accept the terms of this agreement.


Presentation Transcript

Slide1

Using CLIPS to Detect Network Intrusions - (CLIPNIDS)

Phase I

MSE Project

Sripriya

Marry

Committee Members

Dr. David Gustafson (Major Professor)

Dr. Rodney Howell

Dr. Mitchell

NielsenSlide2

Overview

Problem Statement

Purpose and Motivation

Background

Project phases

Project Requirements

User Interface

Cost Estimation

Effort DistributionSlide3

Problem Statement

Objective

To update

Clipnids with the signatures of latest network

attacks so as to

detect and notify network administrators

about

any

unauthorized access to the network resources by intrudersSlide4

Purpose and Motivation

To

excel in the Linux, C and GNU Programming.

Inspired by SNORT.Slide5

Background

I

ntrusion detection: Process of monitoring the events occurring in a computer system or network and analyzing them for signs of intrusion.

Types of Intrusion Detection Systems:

Network-based

IDS

Host-based

IDS

Application-Based IDSSlide6

Types of Analysis:

Misuse

Detection

Anomaly

Detection

Types

of Response:

Passive measure

Active

measure

Conclusion

: CLIPNIDS is Network-based IDS, that uses

“Misuse Detection” analysis technique for detecting intrusions

and uses “Passive Measure” to Respond to intrusions.Slide7

Project phases

Inception Phase.

Elaboration Phase.

Production PhaseSlide8

Inception

Phase

Vision Document

1.0

Project Plan

1.0

Software Quality Assurance

Plan

PrototypeSlide9

Project Requirements

A

ctors

identified for

Clipnids.

Use-Case diagram.

Tasks required to achieve the objective of the project.Slide10

Actors

identified for Clipnids

.

Network

Clipnids

System AdministratorSlide11

Use-Case diagram

.

Slide12

Tasks required to achieve the objective of the project

.

Strong knowledge of Linux, C, GNU Programming and Bash scripting language.

Strong knowledge of GDB tool for debugging.

Migration of source code of CLIPNIDS from PCAP to DAQ to capture packets.Slide13

Integrating of latest versions of decoders and pre-processors from SNORT into

CLIPNIDS

Identifying the version of SNORT using which CLIPNIDS decoder and pre-processors were built

.

Possessing the latest version of SNORT

.

Good understanding of working of expert-system CLIPS

.

Good understanding of working of CLIPNIDS and its architecture

.

Good understanding of working of SNORT and its architecture. Slide14

Modifying

of “conf.clp” file to alter configuration settings for

CLIPNIDS

based on the latest pre-processors

.

Adding new CLIPS files to incorporate the latest signatures

of

intrusions

into pattern database of CLIPNIDS.Slide15

User InterfaceSlide16
Slide17

Cost Estimation

COCOMO Model is used as cost estimation for CLIPNIDS

Effort

= C1 * EAF * (

Size)

P1

Time = C2 * (Effort)

P2

Organic Mode

C1

=

3.2

C2= 2.5

P1

= 1.05

P2= 0.38Slide18

Parameter

Value

Level

RELY

1.00

Nominal

DATA

1.08

High

CPLX

1.15

High

TIME

1.11

High

STOR

1.06

High

VIRT

0.87

Low

TURN

1.00

Nominal

ACAP

0.86

High

AEXP1.00NominalPCAP0.86HighVEXP1.10LowLEXP0.95HighMODP1.00NominalTOOL1.00NominalSCED1.00Nominal

Parameter Name

Effort Adjustment Factor

Value Range

RELY

Required Reliability

0.75-1.40

DATA

Database Size

0.94-1.16

CPLX

Product Complexity

0.70-1.65

TIME

Execution Time Constraint

1.00-1.66

STOR

Main Storage Constraint

1.00-1.56

VIRT

Virtual Machine Volatility

0.87-1.30

TURN

Computer Turnaround Time

0.87-1.15

ACAP

Analyst Capability

0.71-1.46

AEXP

Applications Experience

0.82-1.29

PCAP

Programmer Capability

0.70-1.42

VEXP

Virtual Machine Experience

0.90-1.21

LEXP

Language Experience

0.95-1.14

MODP

Use of Modern Practices

0.82-1.24

TOOL

Use of Software Tools

0.83-1.24

SCED

Required Development schedule

1.10-1.23Slide19

Effort Estimation

– Gantt

chart