/
Wirescans  in PS (all batches at extraction) and SPS at extraction Wirescans  in PS (all batches at extraction) and SPS at extraction

Wirescans in PS (all batches at extraction) and SPS at extraction - PowerPoint Presentation

cora
cora . @cora
Follow
0 views
Uploaded On 2024-03-13

Wirescans in PS (all batches at extraction) and SPS at extraction - PPT Presentation

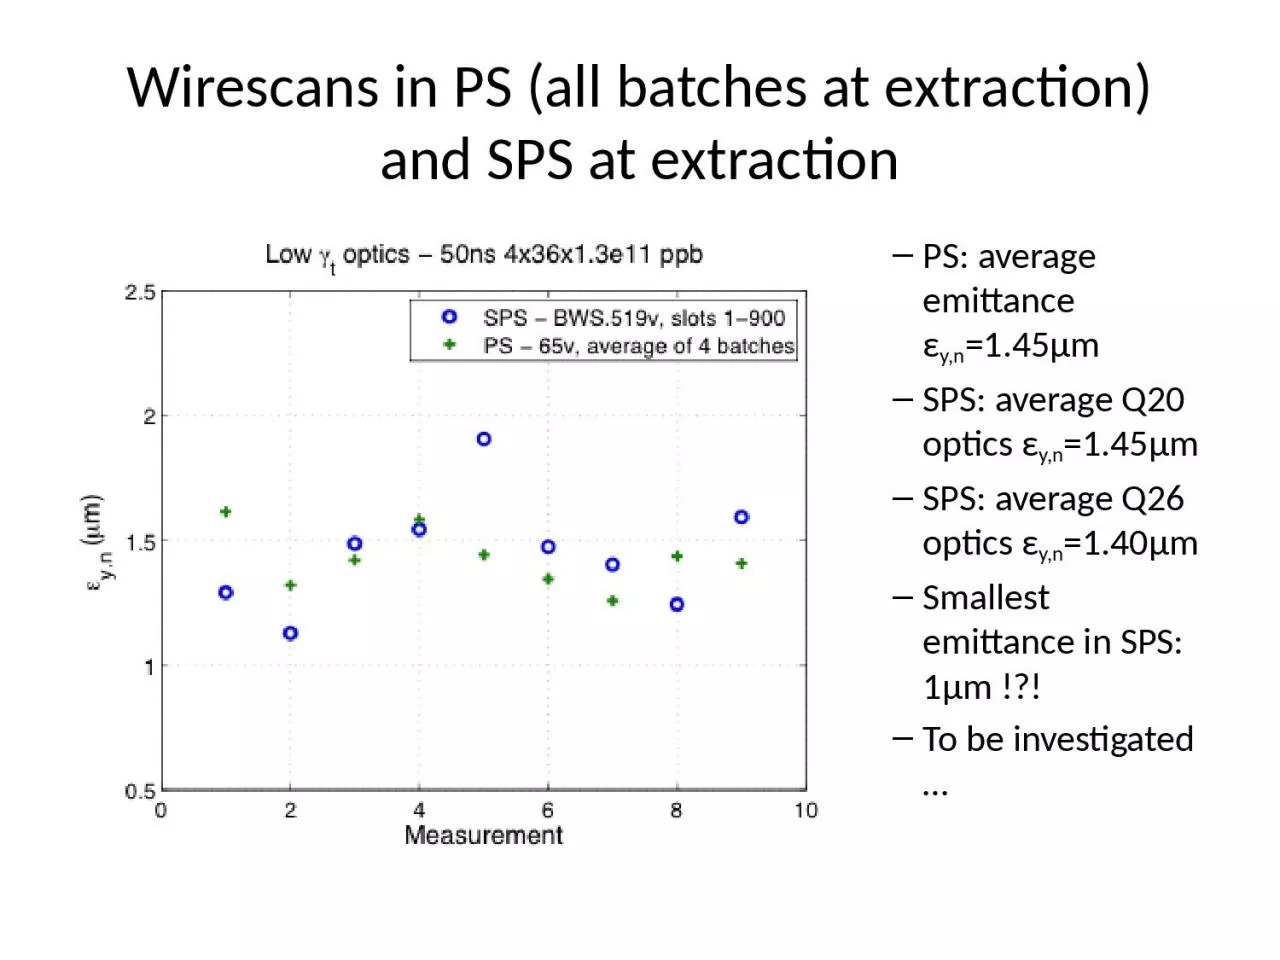
PS average emittance ε yn 145μm SPS average Q20 optics ε yn 145μm SPS average Q26 optics ε yn 140μm Smallest emittance in SPS 1μm To be investigated ID: 1047185

sigma pos profile gaussian pos sigma gaussian profile error full fitps measurements sps average emittance compute define residualsacquired data

Share:

Link:

Embed:

Download Presentation from below link

Download Presentation The PPT/PDF document "Wirescans in PS (all batches at extract..." is the property of its rightful owner. Permission is granted to download and print the materials on this web site for personal, non-commercial use only, and to display it on your personal computer provided you do not modify the materials and that you retain all copyright notices contained in the materials. By downloading content from our website, you accept the terms of this agreement.


Presentation Transcript

1. Wirescans in PS (all batches at extraction) and SPS at extractionPS: average emittance εy,n=1.45μm SPS: average Q20 optics εy,n=1.45μmSPS: average Q26 optics εy,n=1.40μmSmallest emittance in SPS: 1μm !?!To be investigated …

2. BWS Error Sources

3. Q20 data analysisProfile data extracted from the Logging DB (corresponding to ~1h)Offline computation of emittacesSecond emittance computation with N sigma profile pointsPS: signal to noise ratio not optimalSPS: slight sign of PM saturationPSSPS

4.

5. Emittance from 20 sigma profilet(ns)Ε(um)LHCFAST3 cycle timestampSPS Full profile Gaussian fitSPS 20 sigma Gaussian fitPS 20 sigma Gaussian fitPS Full profile Gaussian fit

6. t(ns)Ε(um)LHCFAST3 cycle timestampSPS Full profile Gaussian fitSPS 20 sigma Gaussian fitPS 20 sigma Gaussian fitPS Full profile Gaussian fitEmittance from 20 sigma profile

7. A(mA)A(mV)A(mA)A(mV)ResidualsAcquired profilesPos(um)Pos(um)Pos(um)Pos(um)

8. ResidualsAcquired profilesA(mA)A(mA)Pos(um)Pos(um)Pos(um)Pos(um)A(mV)A(mV)

9. ResidualsAcquired profilesA(mA)A(mA)Pos(um)Pos(um)Pos(um)Pos(um)

10. t(ns)Ε(um)LHCFAST3 cycle timestampSPS Full profile Gaussian fitSPS 2 sigma Gaussian fitPS 2 sigma Gaussian fitPS Full profile Gaussian fitEmittance from 2 sigma profile

11. Calibration table needs to be recomputed120umResidualsAcquired profilesA(mA)A(mA)Pos(um)Pos(um)Pos(um)Pos(um)A(mV)A(mV)

12. ResidualsAcquired profilesA(mA)A(mA)Pos(um)Pos(um)Pos(um)Pos(um)A(mV)A(mV)

13. ConclusionsMost of the measurements are within the expected error (Eerror=2 Sigmaerror)There are some obviously wrong measurements:WS error in the measurementAnother source ?(human, beam, timing…)But the tendency agrees.We can change the average result already in a 20% percent just by using different amount of data -> We need to define precisely what do we call ‘size of the beam’:Which profile do we use to compute sigma?How do we compute sigma?Apply the same everywhereTry to define error bars: In this particular case in the SPS we try to measure sizes of ~350um and the potentiometer resolution is ~200um (in fact ~120um around a centered beam so we have ~ 3 points per sigma)

14. 09.02.2007Wire sanner at the BOOSTER, PS and SPS, B.Dehning14FITThesis: Federico Roncarolo

15. ConclusionsMost of the measurements are within the expected error (Eerror=2 Sigmaerror)There are some obviously wrong measurements:WS error in the measurementAnother source ?(human, beam, timing…)But the tendency agrees.We can change the average result already in a 20% percent just by using different amount of data -> We need to define precisely what do we call ‘size of the beam’:Which profile do we use to compute sigma?How do we compute sigma?Apply the same everywhereTry to define error bars: In this particular case in the SPS we try to measure sizes of ~350um and the potentiometer resolution is ~200um (in fact ~120um around a centered beam so we have ~ 3 points per sigma)The sources of errors attached to this instrument are quite numerous and varied. If we want to withdraw conclusions, take decisions with respect to these kind of measurements we need to build up enough statistics and:The WS is an instrument not easy to set up. Take time to find best measurements conditions.Try to use several.Offline analysis needed: logging of other variables, beta, intensity, dp/p, emittance from op. app.