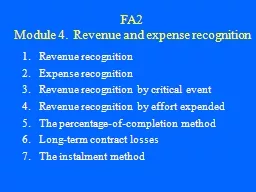
IB Business amp Management IB2 Higher Level Objectives By the end of the lesson students should be able to To classify costs as fixed variable semivariable direct indirect To understand the importance of profit quality ID: 782319
Download The PPT/PDF document "5.2.1 COSTS, REVENUE AND PROFIT" is the property of its rightful owner. Permission is granted to download and print the materials on this web site for personal, non-commercial use only, and to display it on your personal computer provided you do not modify the materials and that you retain all copyright notices contained in the materials. By downloading content from our website, you accept the terms of this agreement.
Slide1
5.2.1 COSTS, REVENUE AND PROFIT
IB Business & Management
IB2 Higher Level
Slide2Objectives
By the end of the lesson, students should be able to: -
To classify costs as fixed, variable, semi-variable, direct, indirect
To understand the importance of profit quality
To know how profit is utilised
To calculate total cost, revenue and profit from given figures
Slide3Formulas to RememberTotal Revenue =
Selling Price X Quantity
Average Revenue
= Total Revenue/Quantity
Contribution
= Selling Price – Variable Cost per unit
Break Even Point
= Fixed Cost/Contribution per unit
Total Contribution
= Contribution X Output
Profit
= Total Sales – Total Costs
Total Cost
= Total Fixed Cost + Total Variable Cost
Average Cost
= Total Cost/Quantity
OR Average Cost
= Average Fixed Cost + Average Variable Cost
Average Fixed Costs (AFC)
= Total Fixed Cost/Quantity
Average Variable Costs (AVC)
= Total Variable Cost/Quantity
Total Variable Costs
= Average Variable Costs X Quantity
Total Fixed Costs
= Average Fixed Cost X Quantity
Slide4What are sales?
Various terms used!
Sales
Revenues
Income
Turnover
Takings
Sales arise through the trading activities of a business
Slide5Calculating sales
The value of sales achieved in a given period is a function of the
quantity
of product sold multiplied by the
price
that customers paid
A formula to remember:
Total sales = Quantity sold x Selling price
Slide6Calculating sales - example
Product
Qty
Price
Sales
£ / unit
£
Blue
5,000
£10
£50,000
Red
2,500
£12
£30,000
Pink
8,000
£11
£88,000
Purple
4,000
£10
£40,000
Total
19,500
£208,000
Slide7Graphing sales
Sales (£
’
000)
Units of Output (
‘
000)
10
0
30
20
50
40
70
60
90
80
100
1
2
3
4
5
6
7
8
9
10
Total sales
Using the sales formula, you can chart the value of total sales. Revenues rise as higher quantities are sold. In the chart below, we assume that each unit of product is sold for the same price (£6). E.g. 10,000 units sold at £6 per unit = total sales of £60,000
Slide8Fixed Costs
Costs which
do not
vary with the level of output
E.g. rent on factory does not change depending on how many products are produced
These costs
can
change over timeVariable CostsThese vary directly with output
i.e. as output rises the variable cost rises
E.g. raw
materials
Types of costs
Slide9Variable & fixed costs
Variable costs
Costs which change as output varies
Fixed costs
Costs which do not change when output varies
Slide10Examples of variable costs
Raw materials
Bought-in stocks
Wages based on hours worked or amount produced
Marketing costs based on sales
Slide11Examples of fixed costs
Rent & rates
Salaries
Marketing (assume all marketing costs are not based on output unless stated)
Insurance, banking & legal fees
Software
Slide12Semi –Variable CostsThese have a fixed and a variable element
They only tend to change when production or sales exceed a certain level of output.
E.g. Mobile Phone Costs – Fixed monthly cost for X minutes, and any extra minutes after that are variable
E.g. Vehicle costs:
Road tax and insurance are FC
Petrol on customer deliveries is a VC
Slide13Classify the following costs according to whether they are fixed, variable or semi-variable:
TASK
Advertising costs
Managers’ salaries
Raw materials
Direct labour
Rent
Interest payments on loans
Insurance
Electricity
Vehicle costs
Slide14Total Costs
Are the sum of variable costs and fixed costs at a particular level of output
TC = FC + VC
Calculate the TC if:
FC for the year = £55,000
VC = £10 per unit
Output = 22,500 units
Calculate the FC if:
TC for output of 1,000 = £42,000
VC = £1.50 per unit
Slide15Cost CentresA
department within an organization that does not directly add to profit, but which still costs an organization money to operate. Cost centers only contribute to a company's profitability indirectly, unlike a profit center which contributes to profitability directly through its actions
. E.g. Marketing department, help desks, customer service call
centres
, Research & Development department
Profit
Centres
A profit center is responsible for generating its own results and earnings, and as such, its managers generally have decision-making authority related to product pricing and operating expenses. E.g. A business may own and operate 10 retail outlets with each retail outlet being considered a profit centre
Slide16Slide17Direct Costs
Costs that can be directly attributed to the production of a particular product or service or allocated to a particular cost centre.
Examples : raw materials and piece rate wages
Indirect Costs
Costs which cannot be directly attributed to the production of a particular product or service or allocated to a particular cost centre.
Examples
:
Managers salaries and rent
Direct and Indirect costs
Slide18Profit = total revenue – total costs
Profit is utilised (used) in several ways:
Tax is paid to the government
Dividends are issued to shareholders
Retained profit is kept in the business for reinvestment
PROFIT
Slide19Profit can be high or low quality
If the profit has arisen as a result of
a one off source
, its quality is said to be
low
quality profit
E.g. sale of part of the business
High quality profit is trading profit which can be expected
to be sustained into future years
i.e. arises from normal trading activities
High quality profit is more attractive to managers and potential investors
Profit quality
Slide20Key terms
Revenue
Output
Fixed cost
Variable cost
Average cost
Semi variable cost
Direct costProfit qualityProfit utilisationProfit marginOne-off profit