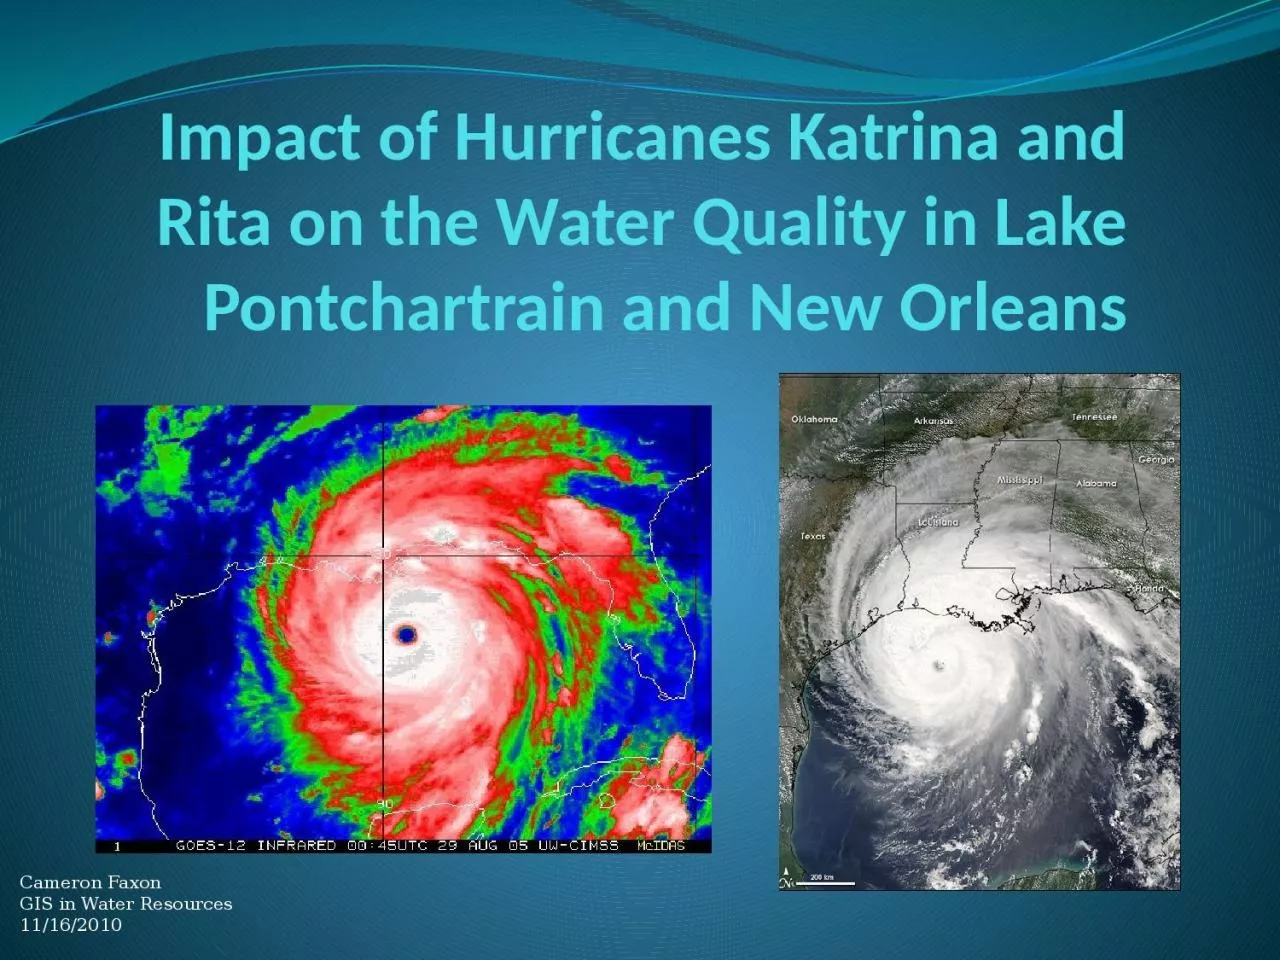
Cameron Faxon GIS in Water Resources 11162010 Hurricane Katrina category 3 Date of Landfall August 29 th Point of Landfall Buras LA Approximately 1200 deaths 1020 feet over normal tide levels ID: 915540
Download Presentation The PPT/PDF document "Impact of Hurricanes Katrina and Rita on..." is the property of its rightful owner. Permission is granted to download and print the materials on this web site for personal, non-commercial use only, and to display it on your personal computer provided you do not modify the materials and that you retain all copyright notices contained in the materials. By downloading content from our website, you accept the terms of this agreement.
Slide1
Impact of Hurricanes Katrina and Rita on the Water Quality in Lake Pontchartrain and New Orleans
Cameron
Faxon
GIS in Water Resources
11/16/2010
Slide2Hurricane Katrina (category 3)
Date of Landfall: August 29thPoint of Landfall: Buras, LAApproximately
1200 deaths10-20 feet over normal tide levels
Slide3Important Waterways
Slide4Storm Surge
Slide5Levee Breaches
Slide6Extent of Flooding
Slide7Hurricane Rita (category 3)
Date of Landfall: September 24th Point of Landfall: Sabine Pass/Johnson’s Bayou
90 tornadoesUp to 10-15 inches of rain
Slide8Sediment/Water Monitoring and Sampling Locations
Slide9Stream Flow at New Orleans-Lake Pontchartrain Interface
Slide10Observations from Rigolets Site (2004-2010)
Average gage height
increase
Slide11Water Quality at Rigolets (2004-2010)
Slight
elevation of salinity
and specific conductance
≈
Oct 2005-Jan 2008
Slide12Coliform Bacteria
Enterobacter
Citrobacter
Members of the
Enterobacteriaceae
family
Gram-
negative
, non-spore forming
Rod shaped
morphology
Presence
indicates pathogen
presence is possible
Bacterial, viral
and parasitic
Slide13Fecal Coliform Bacteria Contamination
E. coli
Klebsiella
W.H.O. designates
E. coli
as primary fecal contamination
indicator bacteria
USEPA
Maximum Recommended Levels
:
Recreational use:
200
cfu
/100ml
Fishing/Boating:
1000
cfu
/100ml
Drinking water: 1
cfu
/100ml
Biosolids
(residential):
1000
cfu
/g
Slide14History of Coliform Contamination at Pontchartrain Beach
Maximum observed
fecal
coliforms
(
cfu
/100ml):
1600
(2004/2007)
170 (2008)
540 (2009)
Slide15Region 6 Katrina Emergency Monitoring Data
Average: 101,778
cfu
/(g-sediment)
Maximum: 1,115,800
cfu/(g-sediment)
Slide16Results of Post-Rita Sediment Sampling
Average: 86335
cfu
/100ml
Maximum: 529140
cfu
/100ml
Slide17Results of Post-Rita Sampling Water Sampling
Average: 7443
cfu
/100ml
Maximum: 76000
cfu
/100ml
Slide18Conclusions
Significantly elevated fecal coliform levels in sediment and water
near populated areasExtremely high fecal coliform
levels in areas that
drain into lake Pontchartrain
Before flooding:
Highest observed levels were
8 times EPA recommended maximums for body-contact water use (Pontchartrain Beach).
After flooding:
Average water samples
had were >
37 times EPA recommended
maximums (body contact)
Average sediment samples
after Katrina were >
86 times EPA recommended
maximums (
biosolids
)
Slide19Further work
Include salinity measurementsInclude dissolved oxygen levelsAnalyze these parameters
to find correlation between data and storm surge/flooding.Estimate total volume increase in lake from storm surge.
Slide20References
Works CitedBrandys, Dr. Bob. H. Quantifying Bacteria Levels in Water Categories 1-3.
Hinsdale, Illinois: Occupational and Environmental Health Consulting Services Inc., 2007.Campanella, Catherine. "New Orleans History~~Lake Pontchartrain." 15 January 2000. 29 September 2010 <http://www.stphilipneri.org/teacher/pontchartrain/section.php?id=79>.
Cobos-Roa
, Robert Bea and Diego. "Failure of the I-Wall Flood Protection Structures at the New Orleans Lower 9th Ward During Hurricane Katrina."
Electronic Journal of Geotechnical Engineering, Vol. 13
(2008): 1-43.
Furey, John S. "Post-Katrina Fecal Contamination in Violet Marsh near New Orleans."
International Journal of Environmental Research and Public Health, 4(2)
(2007): 84-92.
"How could
coliform
bacteria affect water quality?" 2010.
APEC presents: Free Drinking Water.com.
15 November 2010 <http://www.freedrinkingwater.com/water_quality/quality1/1-how-coliform-bacteria-affect-water-quality.htm>.
Jeff Schmaltz, MODIS Rapid Response Team at NASA GSFC.
Visible Earth: A catalog of NASA images and animations of our home planet.
24 August 2005. 15 November 2010 <http://visibleearth.nasa.gov/view_rec.php?id=17314>.
Light Rail Now! News Log.
21 September 2005. 15th November 2010 <http://www.lightrailnow.org/news/n_newslog004.htm>.
NASA. "NASA Facilities Weather Hurricane Rita." 27 September 2005.
NASA Official Web Site.
15 November 2010 <http://www.nasa.gov/vision/earth/lookingatearth/rita_main.html>.
NOAA.
Hurricane Preparedness: Hurricane History.
2010. 15 November 2010 <http://www.nhc.noaa.gov/HAW2/english/history.shtml>.
Oram
, Brian. "Fecal
Coliform
Bacteria in Water."
Water Research Center.
15 November 2010 <http://www.water-research.net/Watershed/fecalbacteria.htm>.
Pesce
, Katie. "Hurricane Katrina: Levee Breaches." 2010.
Mission 2010: New Orleans.
9 November 2010 <http://web.mit.edu/12.000/www/m2010/finalwebsite/katrina/damage/damage-leveebreach.html>.
Punsalan
, Derek.
{saltwater intrusion} lake
pontchartrain
.
2 February 2010.
Wikipedia. "Mississippi River - Gulf Outlet Canal." 23 September 2010.
Wikipedia.
29 September 2010 <http://en.wikipedia.org/wiki/Mississippi_River_%E2%80%93_Gulf_Outlet_Canal>.
Slide21Questions?