/
Preliminary Design  Review Preliminary Design  Review

Preliminary Design Review - PowerPoint Presentation

danika-pritchard
danika-pritchard . @danika-pritchard
Follow
368 views
Uploaded On 2018-11-07

Preliminary Design Review - PPT Presentation

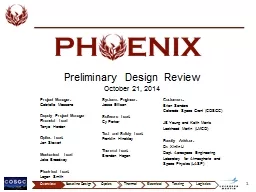
October 21 2014 Project Manager Gabrielle Massone Deputy Project Manager Financial Lead Tanya Hardon Optics Lead Jon Stewart Mechanical Lead Jake Broadway Electrical Lead Logan Smith ID: 721057

bus thermal optics design thermal bus design optics designopticsthermalelectricaltestinglogistics testing electrical baseline payload logistics image heat 2014 phoenix board

Share:

Link:

Embed:

Download Presentation from below link

Download Presentation The PPT/PDF document "Preliminary Design Review" is the property of its rightful owner. Permission is granted to download and print the materials on this web site for personal, non-commercial use only, and to display it on your personal computer provided you do not modify the materials and that you retain all copyright notices contained in the materials. By downloading content from our website, you accept the terms of this agreement.


Presentation Transcript

Slide1

Preliminary Design ReviewOctober 21, 2014

Project Manager:Gabrielle MassoneDeputy Project Manager Financial LeadTanya HardonOptics Lead:Jon StewartMechanical LeadJake BroadwayElectrical Lead:Logan SmithSystems Engineer:Jesse EllisonSoftware Lead:Cy ParkerTest and Safety Lead:Franklin HinckleyThermal Lead:Brenden HoganCustomers:Brian Sanders Colorado Space Grant (COSGC)JB Young and Keith MorrisLockheed Martin (LMCO)Faculty Advisor:Dr. Xinlin LiDept. Aerospace EngineeringLaboratory for Atmospheric and Space Physics (LASP)

1

Overview

Baseline Design

Optics

Thermal

Electrical

Testing

LogisticsSlide2

Presentation OverviewMission OverviewBaseline DesignFeasibility Analysis

Optics and Mechanical DesignThermal DesignElectrical and Software DesignTesting Plan and FeasibilityDesign SummaryLogistics2OverviewBaseline DesignOpticsThermalElectricalTestingLogisticsSlide3

Project Overview

3OverviewBaseline DesignOpticsThermalElectricalTestingLogisticsSlide4

Mission BackgroundLockheed Martin 6U CubeSat Bus Design Reference Mission

to Asteroid 101995-Bennu4OverviewBaseline DesignOpticsThermalElectricalTestingLogisticsSlide5

Mission BackgroundLockheed Martin 6U CubeSat Bus Design Reference Mission

to Asteroid 101995-Bennu5OverviewBaseline DesignOpticsThermalElectricalTestingLogisticsRelevant IR Camera Payload Operations that Drive Phoenix ConOpsSlide6

Mission BackgroundLMCO Bus IR Camera Payload will capture sequence of images of

Bennu asteroid and measure the observed angular rate3.5 µm wavelength in Mid-Wave Infrared (MWIR) Range and geometry specified below:6OverviewBaseline DesignOpticsThermalElectricalTestingLogisticsBennu Asteroid (Reference Environment)IR CameraBennu

FOV

Distance: 10 km

ω

= 0.4061

mrad

/s

Observed:

θ

= 21.93 µrad/s

D = 492 m

T

amb

= 3K

T

sur

= 180-310K

ε

= 0.035Slide7

Mission BackgroundUtilize MWIR nBn detector (Lockheed Martin Santa Barbara

Focalplane)Operating Temperature: 140 KResolution: 1.3 MPx or 1280x1024First MWIR detector Feasible for CubeSat Operations 7OverviewBaseline DesignOpticsThermalElectricalTestingLogisticsReduced Dark Current, Operating Temp. of 140+ K vs 77 K (Traditional)InAs N-doped Semiconductor Layers Sandwiching 100 nm AlAsSb BarrierFigures courtesy of: Applied Physics Letters, October 9, 2006 - 151109Slide8

Mission Background1.3 MPx

(1280x1024) nBn detector Image8OverviewBaseline DesignOpticsThermalElectricalTestingLogisticsFigure courtesy of: laserfocusworld.com January 17, 2014Slide9

Phoenix Objectives

Proto-flight Unit: Defined as hardware that is designed to flight form-factor, but may require additional design, development, testing or flight certification. Not required to undergo environmental testing (thermal-vacuum cycling, vibe, radiation testing, etc…) and will not be flown.9To develop and test the 2U CubeSat MWIR Camera Proto-Flight Payload, a precursor to the flight camera unit for the LMCO Bus MissionOverviewBaseline DesignOpticsThermalElectricalTestingLogisticsSlide10

Phoenix Objectives10

OverviewBaseline DesignOpticsThermalElectricalTestingLogisticsReq.DescriptionParentO.1The payload shall integrate electrically and structurally into the 2U payload section of the Lockheed Martin 6U CubeSat busMS1.SYS.1The electrical system shall interface with the LMCO 6U CubeSat busO.11.SYS.2The mechanical system shall interface with the LMCO 6U CubeSat busO.11.SYS.3The Software system shall interface with the LMCO 6U CubeSat bus

O.1

O.2The payload shall capture a sequence of IR images at the 3.5 µm wavelength and determine the angular velocity and axis of rotation of an observed object with characteristics of the reference asteroid 101995-Bennu

MS

2.SYS.1The electrical system shall capture and store an image from the image sensor.

O.22.SYS.2The optical system shall be able to observe and image the reference target

O.2O.3The payload

shall maintain all components in their operating temperature ranges.MSSlide11

CubeSat Bus Design Constraints11

Bus Electrical ConstraintsRegulated Voltage Lines3.3 V6.0 A Max12 V4.0 A MaxUnregulated Voltage6.5 V – 8.6 V6.0 A MaxTotal Power5 W Nominal Average15 W PeakCommand Communication BusSPI SlaveHigh-Speed Communication BusEthernet, Magnetics-Less DifferentialBackup Communication BusI2CBus Structural ConstraintsTotal Volume 2U (10x10x20 cm)Total Mass2.66 kg + 0.1 kg/ - 0.5 kgOverviewBaseline DesignOptics

Thermal

Electrical

Testing

LogisticsSlide12

Timeline and AssumptionsPhase 1: Simplifying Assumptions

Simulated range between Phoenix and target will vary between 10 km and 100 kmZero Relative translational velocity between object and bus during observation (Phase 2 unit software will account for relative motion)Phoenix payload is not exposed to direct sunlight (i.e. bus orientation or deployables shade payload volume)All test target properties are representative of asteroid 101955-Bennu to the extent feasible12OverviewBaseline DesignOpticsThermalElectricalTestingLogisticsPhase 1May 2015Oct 21

Prototype of all subsystems

First integration and ground-testing

Flight RevisionContinue Remaining Development

Senior Design

Potential Post-Senior Design Development

Delivery

Fully-tested, flight certified

Phase 2

MilestonesSlide13

Phoenix ConOps13

OverviewBaseline DesignOpticsThermalElectricalTestingLogistics Instantaneous observed angular rate of the nearest point is the arctangent of the translational velocity of the surface divided by the observation distance

d

Phoenix is measuring the observed angular rate (theta), not the rotation rate of the object (omega)Slide14

Phoenix ConOpsCulmination of design is fully-integrated ground-test of sensor and representative target object

14OverviewBaseline DesignOpticsThermalElectricalTestingLogisticsSlide15

Baseline Design

15OverviewBaseline DesignOpticsThermalElectricalTestingLogisticsSlide16

Design Overview

16RadiatorPanelsBus Mechanical InterfacePower BoardCDH BoardThermal StrapSensor Board

Primary Mirror

Secondary Mirror

2U CubeSat Payload

10cmx10cmx20cm

Overview

Baseline Design

Optics

Thermal

Electrical

Testing

Logistics

10 Cm

10 Cm

2

0 CmSlide17

Functional Block Diagram17

OverviewBaseline DesignOpticsThermalElectricalTestingLogisticsStructure and Optics Focusing AssemblyStructureThermal Control Mechanism

Optics Assembly

* LMCO 6U CubeSat Bus

Electronics

Bus Thermal Isolation

*Sensor Interface

(COSGC)

Field of View

Phoenix Camera Payload

*COTS or Customer-Provided

*Image Sensor (LMCO)

Camera Controller

Main Processor

Image Processing and Compression Software

Thermal Controller

Power Regulation

Bus Power and Data Interface

PWR

PWR

PWR

Thermal Feedback

Image Data, Sensor Control

PWR

PWR

Post-Processed Image Data

Power

Bus Power Supply

DataSlide18

Critical Project ElementsMechanical Optics Assembly DesignThermal System DesignCooling the nBn sensor

Electronics and Software SystemInterfacing with nBn sensorMeasuring Rate from Image SequenceTesting PlanGround testing to simulate flight functionality18OverviewBaseline DesignOpticsThermalElectricalTestingLogisticsSlide19

Optics and Structure

19OverviewBaseline DesignOpticsThermalElectricalTestingLogisticsSlide20

Bennu Radiometry

Percentage of total light in 3 to 4 µm band due toSolar irradiance (~12-15%)Bennu blackbody radiation (~85-88%)Photon Budget:  20OverviewBaseline DesignOpticsThermalElectricalTestingLogisticsTotal Photon FluxPhoton Flux (photon/s)Range (km)Cassegrain

Optics

Refractive Optics

40

6

0

8

0100

3x10132

x10131x1013Slide21

Bennu Radiometry21

OverviewBaseline DesignOpticsThermalElectricalTestingLogisticsSlide22

Baseline Optical DesignCDD baseline designs:Multi-element refractive & Cassegrain optical systems

MWIR bandwidth is diffraction limited22OverviewBaseline DesignOpticsThermalElectricalTestingLogisticsSource: http://microscopy.berkeley.edu/courses/tlm/optics/imaging.htmlDiffraction Limit IllustrationResolvable Airy Disk

Resolvable Airy Disk

Unresolvable Airy Disk

Unresolvable Airy Disk

Airy DiskSlide23

Baseline Optical DesignChief deciding factors: Mass, Thermal Control, Size, etc…

23OverviewBaseline DesignOpticsThermalElectricalTestingLogistics

Cassegrain selected for O

ptical Design

Refractive

Mass ~ 1.8 kg

Active Thermal Cooling

Chromatic Aberrations

Length ~ 12.5 cm

High Design Complexity

Bandwidth: 3.0 – 3.74 µm

Cassegrain

Mass ~

1.0

kg

Passive Thermal Cooling

No Chromatic Aberrations

Length ~ 10 cm

Bandwidth: 3.0 to 3.61 µmSlide24

Zemax SimulationUtilized paraxial ray tracing equations to derive design constraints

Zemax simulation to prove design methodology  24OverviewBaseline DesignOpticsThermalElectricalTestingLogistics

Spot Diagram

FPA

Primary Mirror

Secondary Mirror

Cassegrain SimulationSlide25

Mechanical Budget

SubsystemMass (g)Structures328Optics81Electronics59Thermal Control157Total625Allowable Mass2000Contingency137525OverviewBaseline DesignOpticsThermalElectricalTestingLogistics

Large Mass Contingency

Values from

Solidworks Model EstimatesSlide26

Path ForwardDesign aspherical lenses to reduce aberrations and add bandpass filter

Make Zemax program to optimize system PSF and minimize ΔT impacts on systemDesign cold stop to reduce background thermal noiseThorough calculation of SNR and SBR with respect to all noise inducing elementsCall prospective suppliers to check for issues with budget and feasibility constraints26OverviewBaseline DesignOpticsThermalElectricalTestingLogisticsSlide27

Thermal

27Slide28

Current Thermal ConceptBus will shield the payload from solar rays

Bus interface within -24 to 61 ºCInterface will be isolated using low conductance bolts and/or structural elementsMLI insulation between bus and payloadAluminum radiators coated in high-emissivity white paint on all payload sidesTEC to reduce focal plane temperature to ~140KFrom manufactures specification28OverviewBaseline DesignOpticsThermalElectricalTestingLogistics

6U Bus Conceptual Configuration

2U Phoenix Camera VolumeSlide29

Thermal Electric Cooler (TEC)Operates using the Peltier

EffectP and N type semiconductors physically in parallel but electrically in seriesDraws heat from one side to the otherCan be stacked to produce additional coolingTwo Stage Baseline Model~1W of consumed powerMax heat in: 0.3WDelta Tmax: 92 KSmall Size3.9mm x 3.9mm x 4.4mmLong operating life<100,000 hrs29Source: https://www.ferrotec.com/images/thermal-site/twoStage.pngOverviewBaseline DesignOpticsThermalElectricalTesting

LogisticsSlide30

Primary Thermal Paths30

Bus Interface T = -21 to 64 ºCQbusOverviewBaseline DesignOpticsThermalElectricalTestingLogisticsQSunAluminum Radiator 700cm

2 (White Paint Coating α=0.09

ε=0.92)

Q

Radiated

Q

albedo

Optics Assembly

TEC

W

bus

nBn Focal Plane

Command and Data Handling (CDH) Board

Electrical Power and Bus Interface Board

Thermal Isolation

Q

Radiated

Bus Solar Shade

Bus Solar Shade

Phoenix Payload

Key

Radiation

Conduction

High Resistance

Low Resistance

Electric WorkSlide31

Thermal Modeling Strategy

Goal: Full System Thermal Model using Thermal Desktop SoftwareFall 2014: Develop basic thermal models comparing ~10-25 nodes in both Simulink and Thermal DesktopPost-CDR: Continue Thermal Modeling with Thermal DesktopGoal: model agrees to within ± 5 K of actual hardware temperatures (AFRL Standard)Driving Issue:Thermal Desktop results are complex - it can be difficult to identify errors in basic modelSolution:Develop two independent modelsVerify results of Thermal Desktop model before moving forward31OverviewBaseline DesignOpticsThermalElectricalTestingLogisticsSlide32

Thermal Desktop Model (Steady State)32

Aluminum Radiators with White Paint Coating Bus-Payload Mechanical Interface~10WCDH Board~0.3WEPS Board (Not-Pictured, behind CDH board)~0.7WNot currently in modelThermal Electric Cooler~1WnBn Focal Plane~0.3WOptics Assembly

Bus Simulator

Modeled as 10W constant heat source

Hottest part of the payload is the bus interface

CDH Board

EPS Board

EPS Board

Cold Space ~3K

Green Arrows-Conduction to parts contacting that face

Brown Arrows-Conduction receiving nodes from other parts contacting that face

Red Arrows-Heat loads on that surface

Balls-Nodes of the model

Overview

Baseline Design

Optics

Thermal

Electrical

Testing

LogisticsSlide33

Simulink Thermal Model33

OverviewBaseline DesignOpticsThermalElectricalTestingLogisticsMajor components modeled as Simulink subsystems with heat inputs and outputsSubsystem blocks contain models of thermal resistivities and conductivitiesSlide34

Feasibility Analysis (Simulink)34

RadiatorArea700 cm2Emissivity0.92MaterialAluminumThermal ConductivitiesAluminum237 W/(m*K)PCB (FR4/Copper)0.33 W/(m*K)Glass (Optical Lenses)1.05 W/(m*K)Bus InputsMax Qin10 WQin to Electronics7 W (30%)Qin to Optical Assembly3 W (70%)Qin to TEC/Focalplane0 W (negligible)Asteroid InputsMax Qin

1.56 μW

Qin to Focalplane0.312 μW (20%)

Qin to Optical

Assembly1.248 μW (80%)Qin to TEC/

Focalplane0 W (negligible)

Other PropertiesGlass Emissivity

0.93Time to Steady State

10,000 seconds

Simulink Simulation Assumptions & Parameters:

Overview

Baseline Design

Optics

Thermal

Electrical

Testing

LogisticsSlide35

Feasibility AnalysisUsing the worst case power inputs, the steady state temperature is low enough for the TEC to cool the focal plane to 143K (

ΔT ~92K). While this is higher than the optimal 140K, the noise induced by the higher temperature could be processed out. Additionally the optical assembly does not need to be cooled35Simulation InputsHeat from Bus into Sys.10 WHeat from Asteroid1.5 μWPower into Focalplane0.3 WPower into Electronics1.0 WPower into TEC1.0 WTotal Energy into Sys.12.3 WSimulation OutputsHeat out of Radiator11.2 WHeat out of Optics3.0 WHeat out of TEC2.4 WHeat out of Electronics7.3 WHeat out of Focalplane0.8 WSteady State Tradiator235.4 KOverview

Baseline Design

Optics

Thermal

Electrical

Testing

LogisticsSlide36

Feasibility AnalysisThe steady state temperature drops by 5K, reducing the necessary

ΔT to 90K. This shows that with a 10% reduction in heat from the bus the TEC can cool the focal plane to the desired temperature. 36Simulation InputsHeat from Bus into Sys.9.0 WHeat from Asteroid1.5 μWPower into Focalplane0.3 WPower into Electronics1.0 WPower into TEC0.3 WTotal Energy into Sys.10.6 WSimulation OutputsHeat out of Radiator10.2 WHeat out of Optics2.70 WHeat out of TEC2.24 WHeat out of Electronics6.6 WHeat out of Focalplane0.69 WSteady State Tradiator230.0 KOverview

Baseline Design

Optics

Thermal

Electrical

Testing

Logistics

Considering a case where the payload receives less heat from the bus (the bus is in a power saving mode, and less subsystems are turned on, therefore less heat is generated)Slide37

Path ForwardContinue adding payload elements to the Thermal Desktop ModelUpdate the Simulink Model material properties as materials are chosen

Compare the results of the two models to verify consistency and accuracyUse Thermal Desktop Model for final thermal analysisExtra volume available if additional active thermal control required Linear Stirling Cooler or multiple TECsExploring Thermal Isolation mechanismsMLI, high thermal-resistance materials37OverviewBaseline DesignOpticsThermalElectricalTestingLogisticsSlide38

Electrical and Software

38OverviewBaseline DesignOpticsThermalElectricalTestingLogisticsSlide39

Electronics Overview39

OverviewBaseline DesignOpticsThermalElectricalTestingLogisticsnBn Image SensorImage Sensor BackplaneCommand and Data HandlingPower Regulation

Raw Image Data

Power

Small Adapter Board for nBn Mid-Wave IR Sensor

Low Thermal Resistance Substrate

Processes Images and Commands

High-Density Multi-Layer Board

Provides power regulation and isolation from the bus

Primary bus interface

Baseline Design: Custom PCB StackupSlide40

Electronics40

Image Sensor BackplaneCommand and Data HandlingPower Regulation & IsolationBus InterfacePower RegulationIsolationThermal Electric Cooler SwitchingMonitoring & Protection CircuitryImage Sensor InterfaceMemoryCPUnBn Sensor

TEC

Overview

Baseline Design

Optics

Thermal

Electrical

Testing

LogisticsSlide41

Power Budget

Design ElementReference ComponentNominal Power ConsumptionTECLaird MS2 series1.0 WCPUAtmel SAMA5D4 series0.20 WImage Sensor InterfaceXilinx Spartan3 series0.16 WFocal PlanenBn-sensor0.05 WMemoryMicron SDRAM0.39 WPower RegulationBuck/Boost 90% efficient0.80 WTEC ControlBuck 90% efficient0.10 WRaw TotalNo Margin2.7 WSystem Margin20%0.54 WTotal + Margin3.2 W

Contingency

1.8 W

41

Budget 5W nominal, 15W 10 minute burst

Overview

Baseline Design

Optics

Thermal

Electrical

Testing

LogisticsSlide42

Software Flow Diagram42

Standby ModeActive ModeInitializeWait for CommandPackage DataSend Data to BusCommand?Picture CommandReport Health and StatusGet Focalplane Temp

nBn Cool?

Take Picture Burst

Picture

Cmd

Type

Compress Image and Package

Send Image to Bus

Determine Rate

No

Yes

Overview

Baseline Design

Optics

Thermal

Electrical

Testing

Logistics

Rate Determination Algorithm

(Cont. Next Slide)Slide43

Software Flow DiagramHarris Corner DetectionInterest

point identifierInvariant to translations and rotationsSIFTUsed to classify each interest point and keep only those robust to local affine distortion43Rate Determination AlgorithmNoise Reduction (Optional)Harris Corner Detection & SIFT Keypoint DescriptorsRepeat for 2+ Image SequenceOverviewBaseline DesignOpticsThermalElectricalTesting

Logistics

Match SIFT

Keypoints

Calculate Rate Solution

Send Solution to BusSlide44

ExamplesHarrisSIFT Algorithm

Interest Point Detection and MatchingImage Rotated 180º44OverviewBaseline DesignOpticsThermalElectricalTestingLogisticsFigure generated using Integrated Vision Toolkit and HarrisSIFT AlgorithmSlide45

Temporal Budget

Maximum allowable exposure time 2.28 secondsBennu rotation rate + 1σ = ~22μradians/secondRotation of 50 μradians corresponds to a single pixelCorresponds to minimum spacing of imagesMaximum image capture spacingCase of rotation gives about 9 hoursWill use as baseline limit 45OverviewBaseline DesignOpticsThermalElectricalTestingLogistics

T = 9

Hrs

Surface Feature

T = 0

HrsSlide46

Path ForwardDetermine data rates and create data budgetSelect Processor and Electrical Components

Begin Electrical SchematicsSelect Software PlatformOperating System (i.e. Linux)Bare MetalSoftware Algorithm development46Slide47

Testing Feasibility

47OverviewBaseline DesignOpticsThermalElectricalTestingLogisticsSlide48

Preliminary Testing PlanSetup and Procedure

Test Chamber contains Phoenix Camera and Test TargetOptics AdapterMGSE structureEGSE conduitsPhoenix captures MWIR images, determines observed angular rateCompare theoretical and actual angular rateTest EquipmentVacuum chamber capable of < 1 torr (procurable)Liquid Nitrogen cooled to 75K (procurable)Radiative heat transfer error 5% at Tsurr = 108.9 K0.632 L/min circulation rate for∆T = 5K16.6 mL/min vaporization rateEGSE and MGSE48OverviewBaseline DesignOpticsThermalElectricalTestingLogisticsSlide49

Environmental ControlPhoenix Camera and test hardware mounted to sledLN

2 cooling jacket maintains ~75 K wall temperature12.5” fiberglassinsulation (two layers of R19 batt) to reduce LN2 loss49OverviewBaseline DesignOpticsThermalElectricalTestingLogisticsCross Section of Test Chamber, with minimum required dimensions12.5”Slide50

Test Target and ScalingTest Target Objective:

To replicate the scale, motion, and spectral qualities of reference asteroid 101995-BennuHollow Sphere, 10 cm diameterInternal heating elements heat to 310 K (illuminated side) and 180 K (dark side)Heater wires through slip-ring to allow target rotationOptics Adapter (Zoom 0.300X)Scaled distance: 203 cmActual distance: 61 cm50ParameterValue (Bennu)Value (Target)Diameter492 m10 cmObservation Distance10 km203 cm (effective)Rotation Rate0.4061 mrad/s0.8904 mrad/sObserved Angular Rate21.93 µrad/s21.93 µrad/sOverviewBaseline DesignOptics

Thermal

Electrical

Testing

LogisticsSlide51

Phoenix Scaled Testing

51Bennu Asteroid (Reference Environment)Phoenix (Scaled Ground Test)CameraPhoenixOptics AdapterZoom: 0.300X101995-Bennu

Actual Distance: 63 cm

Effective Distance: 203 cm

FOV

FOV

Distance: 10 km

Test Target

Hollow Sphere

Heated

ω

= 0.4061

mrad

/s

ω

= 0.8904

mrad

/s

Observed:

θ

= 21.93 µrad/s

Observed:

θ

= 21.93 µrad/s

D = 10 cm

D = 492 m

T

amb

= 3K

T

amb

= 75 K

T

sur

= 180-310K

ε

= 0.035

T

sur

= 180-310K

ε

=

~0.035

Overview

Baseline Design

Optics

Thermal

Electrical

Testing

LogisticsSlide52

Path ForwardExplore testing opportunities and capabilities at Space Operation Simulation Center (SOSC) at Lockheed Martin in

WatertonConfer with Matt Rhode for all LN2 Handling and TestingDetail intermediate testing plans for system build-upDetermine required optical/thermal properties of test target to accuracy required for construction52OverviewBaseline DesignOpticsThermalElectricalTestingLogisticsSlide53

Design Summary

53OverviewBaseline DesignOpticsThermalElectricalTestingLogisticsSlide54

Design Summary54

nBn Image SensorImage Sensor BackplaneCommand and Data HandlingPower RegulationRaw Image DataPower2U MWIR Camera Volume, 700 cm2 Radiator AreaTwo-Stage Thermoelectric CoolerCustom Electronics and Software

Cassegrain

Reflector Optics

Overview

Baseline Design

Optics

Thermal

Electrical

Testing

LogisticsSlide55

Logistics

55OverviewBaseline DesignOpticsThermalElectricalTestingLogisticsSlide56

Fall Schedule56

OctoberNovemberDecemberMajor Milestones10/13-10/1910/20-10/2610/27-11/02

11/03-11/09

11/10-11/16

11/17-11/23

11/24-11/30

12/01-12/07

12/08-12/14

12/15-12/21

12/22-12/28

12/29-01/05

PDR

Simulink

Thermal Model

Thermal Desktop Model

Zemax

Optics Model

Solidworks

Model

Electrical

Component Selection

Electrical Schematics

Electrical Layout

CDR

FFR

Overview

Baseline Design

Optics

Thermal

Electrical

Testing

LogisticsSlide57

Monetary Budget57

OverviewBaseline DesignOpticsThermalElectricalTestingLogisticsComponentCost EstimateOptics (mirrors, lenses)$5,000Electronics$1,500Thermal$1,000Mechanical$1,000Test Equipment$1,000Total$9,500Margin 20%$1900Total + Margin

$11,400

Contingency$8600

Funds available to team: $20,000Slide58

Team Management ToolsRedmine Project Management Web Application

Issue tracking systemGantt Chart and CalendarConfiguration ManagementGit version controlCentral file storage – Odyssey serversFile and component naming schemes SYS.###.Rev_FileDescriptorEx: STR101.2_MassBudgetTest/Requirements Verification Software58OverviewBaseline DesignOpticsThermalElectricalTestingLogisticsSlide59

Concluding Statements

59OverviewBaseline DesignOpticsThermalElectricalTestingLogisticsSlide60

ConclusionsThank you for your time

AcknowledgementsPAB Faculty and StaffFaculty AdvisorDr. Xinlin LiOur customersBrian Sanders (COSGC)JB Young (LMCO)Keith Morris (LMCO)60OverviewBaseline DesignOpticsThermalElectricalTestingLogisticsSlide61

References61

[1] Adams, Arn. "ADVANCES IN DETECTORS: HOT IR Sensors Improve IR Camera Size, Weight, and Power." Laser Focus World. PennWell Corporation, 17 Jan. 2014. Web. 13 Sept. 2014.[2] "An Introduction to the NBn Photodetector." UR Research. University of Rochester, 2011. Web. 12 Sept. 2014.[3] "ARCTIC: A CubeSat Thermal Infrared Camera." TU Delft. Delft University of Technology, 2013. Web. 13 Sept. 2014.[4] Cantella, Michael J. "Space Surveillance with Infrared Sensors." The Lincoln Laboratory Journal 1.1 (1989): n. pag.Lincoln Laboratory. MIT, June 2010. Web. 9 Sept. 2014.[5] Cleve, Jeffrey V., and Doug Caldwel. "Kepler: A Search for Extraterrestrial Planets." Kepler Instrument Handbook (2009): n. pag. 15 July 2009. Web. 12 Sept. 2014.[6] "James Webb Space Telescope - Integrated Science Instrument Module."ISIM. Space Telescope Science Institute, n.d. Web. 13 Sept. 2014.[7] "NBn Technology." IR Cameras. IRC LLC, n.d. Web. 13 Sept. 2014.[8] Nolan, M.C. et al, “Shape model and surface properties of the OSIRIS-Rex target Asteroid (101955) Bennu from radar and lightcurve observations,” Icarus, Vol. 226, Issue 1, 2013, pp. 663-670.

[9]

Otake, Hisashi

,

Tatsuaki Okada, Ryu Funase

, Hiroki Hihara, Ryoiki

Kashikawa, Isamu Higashino, and Tetsuya Masuda. "Thermal-IR Imaging of a Near-Earth Asteroid." 

SPIE: International Society of Optics and Photonics. SPIE, 2014. Web. 13 Sept. 2014.

[10] "Spitzer Space Telescope Handbook." Spitzer Space Telescope Handbook 2.1 (2013): n. pag. Spitzer Space Center, 8 Mar. 2013. Web. 8 Sept. 2014.

[11] Vanbebber, Craig. "Lockheed Martin Licenses New Breakthrough Infrared Technology." Lockheed Martin Corporation, 7 Dec. 2010. Web. 9 Sept. 2014.Slide62

Backup Slides

62Slide63

Trade Studies Backup

63Slide64

Trade Study Scoring10

Excellent, design best satisfies the criteria compared to the other design options8-9 Good, satisfies the criteria well5-7 Mediocre, satisfies the criteria with some difficulty or challenge3-4 Poor, difficult to satisfy design criteria, presents technical challenges1-2 Very poor, presents significant challenge to satisfy criteriaR = Raw Score W = Raw Score*Weight Total = Sum(W)64Slide65

Optics Trade Study65

Sensitivity AnalysisSlide66

Thermal Trade Study66

Sensitivity AnalysisSlide67

Electronics Trade Study67

Sensitivity AnalysisSlide68

Optics Backup

68Slide69

Paraxial Ray Tracing Equations69

Equation 2:  Equation 1:  http://ecee.colorado.edu/~ecen5616/WebMaterial/05%20paraxial%20ray%20tracing.pdfSlide70

Optics Design EquationsPhoton Budget:Planck’s Blackbody Radiation Equation

Stefan-Boltzmann’s LawCassegrain Constraints:70  


EFL – effective focal length

BFD – back focal distance

tps

– mirror separationSlide71

Transmissive DesignCooke Triplet Constraints

Zemax Simulation71


Custom Gauss Triplet

Cooke TripletSlide72

Optical Thermal AnalysisUsed Stefan-Boltzmann equation to calculate light passing through Cold StopSignal to background ratio for 230

° K optical system72BennuSlide73

Thermal Backup

73Slide74

Peltier Effect in TEC

Thermoelectric coolers use the Peltier Effect to generate temperature gradientWhere is the Peltier coefficient of the conductor A, of the conductor B, and I is the electric current from A to B. Peltier coefficients represent how much heat is carried per unit charge. If A and B are different, and a simple thermoelectric circuit is closed then the Seebeck effect will drive a current, which in turn will always transfer heat from the hot to the cold junction. 74Slide75

Simulink – Electronics Subsystem 75

Subsystem Specific Values:Electronic Board Area – 200cm^2Electronic Board Thickness – 0.173cm Radiation Coefficient of PCB – 4.82E-8 W/m^2*K^4Specific Heat of PCB – 810 J*K/kgSlide76

Simulink – Optical Subsystem 76

Subsystem Specific Values:Optical Assembly Area – 314cm^2Radiation Coefficient of Glass – 1.1E-9 W/m^2*K^4Specific Heat of Glass – 447 J*K/kgSlide77

Simulink – Focalplane Subsystem

77Subsystem Specific Values:Focal Plane Area – 19.625cm^2Slide78

Simulink – TEC Subsystem

78Subsystem Specific Values:TEC Area – 15.21mm^2TEC Thickness – 4.4mmSlide79

Simulink – Radiator Subsystem

79Subsystem Specific Values:Radiator Area – 700cm^2Radiator Thickness – 5mmRadiation Coefficient – 5.21e-8 W/m^2K^4Radiator Mass – 0.25 kgSpecific Heat of Aluminum – 900 J*K/kgSlide80

Electronics Backup

80Slide81

Custom PCB Examples

Previous designs by Phoenix team members81Communications Board: Xilinx Kintex 7 FPGA, high-speed DDR3 MemorySlide82

Custom PCB ExamplesAttitude Determination and Control: SAMA5 ARM Processor and High-Speed Memory

82