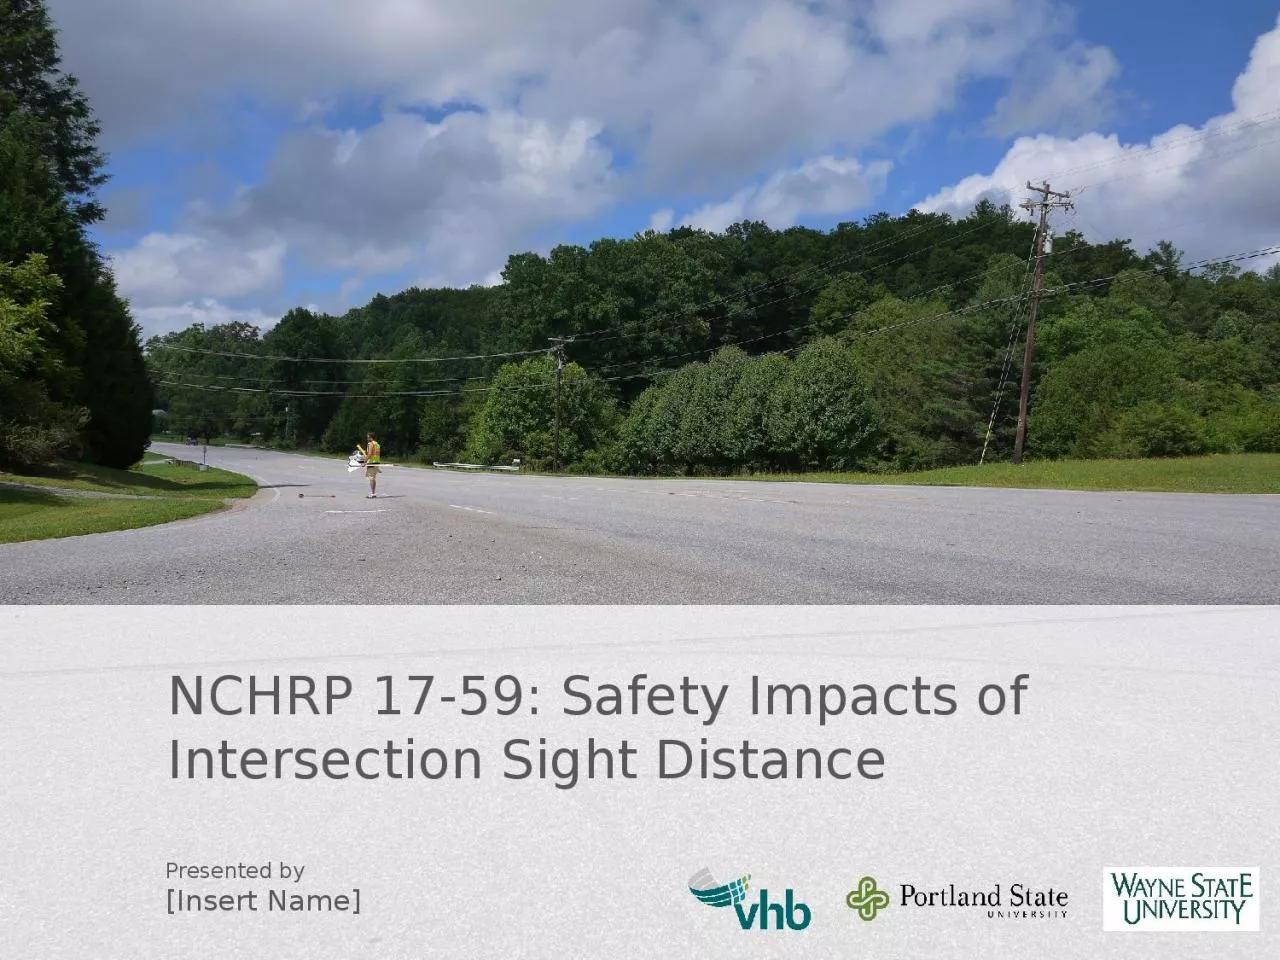
/
NCHRP 17-59: Safety Impacts of Intersection Sight NCHRP 17-59: Safety Impacts of Intersection Sight

NCHRP 17-59: Safety Impacts of Intersection Sight - PowerPoint Presentation

davies
davies . @davies
Follow
65 views
Uploaded On 2023-11-04

NCHRP 17-59: Safety Impacts of Intersection Sight - PPT Presentation

Distance Presented by Insert Name Overview NCHRP 1759 Background and Objectives Research Methods Research Findings Models Application Conclusions Project Background and Objectives NCHRP 1759 Safety Impacts of Intersection Sight ID: 1028688

road isd major target isd road target major crashes intersection crash injury aadt fatal direction sight minor approach data

Share:

Link:

Embed:

Download Presentation from below link

Download Presentation The PPT/PDF document "NCHRP 17-59: Safety Impacts of Intersect..." is the property of its rightful owner. Permission is granted to download and print the materials on this web site for personal, non-commercial use only, and to display it on your personal computer provided you do not modify the materials and that you retain all copyright notices contained in the materials. By downloading content from our website, you accept the terms of this agreement.


Presentation Transcript

1. NCHRP 17-59: Safety Impacts of Intersection Sight DistancePresented by [Insert Name]

2. OverviewNCHRP 17-59 Background and ObjectivesResearch MethodsResearch FindingsModelsApplicationConclusions

3. Project Background and Objectives

4. NCHRP 17-59: Safety Impacts of Intersection Sight DistanceProject initiated in 2012Project Team:VHBWayne State UniversityPortland State UniversityMr. Stephan Parker, NCHRP Senior Program OfficerNCHRP 17-59 Panel MembersHighway Safety Information System

5. Research IssuesGap acceptance crashes:One of most common crashes at unsignalized intersectionsInfluenced by intersection sight distance (ISD)ISD: Key design element at intersectionsContributes to ability of drivers on minor road to identify appropriate gapsDrivers on major road approach can see vehicles on minor roadAASHTO provides criteria for minimum ISD, yet … ISD may change over timePhysical conditions, vehicle performance, and driver behavior influence gap acceptanceAdequate ISD alone may not be sufficient

6. How does sight distance at this intersection relate to crash frequency?

7. ObjectivesIdentify appropriate definitions and existing methods to measure ISDIdentify a standardized method for measuring ISDQuantify the relationship between safety and ISD for stop-controlled intersectionsDevelop easy to use graphics for practitioners to evaluate the safety impact of ISD

8. Key TerminologyDesign ISD: Minimum ISD as identified in the Green BookExisting (or available) ISD: ISD as measured in the fieldProposed ISD: ISD under consideration and is expected to result from a change in the intersection environmentMinor Road: Roadway that is stop-controlled, drivers must yield to approach vehiclesMajor Road: Uncontrolled at the intersection, typically higher traffic volumesTarget Crash: Involves vehicle from major road colliding with vehicle entering from minor roadTarget Fatal and Injury Crash: Target crash that results in at least one injury or fatality

9. Research Methods

10. Research Approach and MethodsLiterature reviewReview of existing ISD practicesEstablish ISD protocolCollect data with protocolField data collectionDesk-top data collectionData analysis

11. Literature ReviewRelevant past ISD-related safety studies are somewhat inconsistent in direction and magnitudeReview provided direction for data collection plan and study design; confirmed wide range of factors should be field-collected and thoughtfully consideredIdentified countermeasures that are used or could be used by agencies to improve locations with sight distance concerns

12. Review of Documented ISD PracticesPurpose: To understand how State and local agencies define visual obstructions and collect ISD measurements in the fieldHelped determine what processes and parameters should be followed in fieldReadily-available policies were collected from State and local transportation websites

13. Findings of Review of ISD PracticesMost reviewed policies did NOT define specific field procedures for determining ISDMost reviewed policies incorporate exact AASHTO values for driver eye height and object height, although some elect to use 4.25 ft for object height instead of reciprocal 3.5 ftMany agency policies confirm acceptance that objects can be located within the sight triangle and not necessarily obstruct ISD

14. Establish ISD Collection ProtocolTested data collection methods Identified a standardized method for measuring ISD in field

15. Key TermsISD is the sight distance provided at intersections to perceive the presence of conflicting vehicles. Available ISD is the measurable unobstructed view a driver has at an intersection. Decision point (DP) is the location where drivers on the minor road stop, view traffic, and decide when to enter the intersection. Critical point (CP) is the location on the road where the observed object begins to appear. Target crashes involve a vehicle from the major road colliding with a vehicle from a minor road.

16. Data Collection ApproachTwo-person team: sighter and targeter

17. Data Collection: Applying the Protocol17

18. Process Overview3States1,658ISD measurements800+IntersectionsNCOHWA

19. Sites Visited19NC - 286WA - 265OH - 281

20. Data Collected in the Office, Verified in the FieldRoadwayNumber of through lanesDivided/undivided major roadHorizontal curvatureTraffic/OpsTraffic controlPresence of left-turn lanes(major & minor)Presence of right-turn lanes (major & minor)Presence of on-street parking

21. Data Collected in the FieldRoadwayStandard available ISDBest available ISDConfirm visibility of traffic controlLane widthShoulder WidthMedian widthLighting PresenceVertical grade

22. Data Collected in the FieldTraffic/OpsMajor road traffic volume Minor road traffic volume Posted speed limit

23. Data Collected in the OfficeCrashLocationTypeSeverityInitial direction of vehiclesSequences of eventsLight conditionWeather conditionVehicle typeRoadwayMajor road functional classMinor road functional classArea typeAccess densityQuality of sight distanceTraffic/OpsMajor road traffic volume Minor road traffic volume Intersection angle

24. Crash Data Collection – Total Target CrashesTotal crashes: A crash occurring at, or within, the influence area of an intersection. Influence area includes crashes that occur within 250 feet of the intersection along the major road.One vehicle on the mainline and one on the minor road.

25. Crash Data - Subsets of Target CrashesInjury Crashes: KABCRight-angle crashesAngleLeft-turnRight-turnDay-time crashes: Daylight

26. Analysis UnitEach site was divided into two analysis units (i.e., left-direction and right-direction) by major road direction

27. Data Collection SummaryTerrainNC(286)OH(281)WA(265)RuralUrbanRuralUrbanRuralUrbanLevel341128627149Mountainous48360010Rolling749348435589Grand Total156130176105127138Major Route TypeNCOHWARuralUrbanRuralUrbanRuralUrban2-lane Major65431125372624-lane Major Undivided404623338474-lane Major Divided514141194828Grand Total156130176105128137State20082009201020112012TotalWA36384637--157OH64758084--303NC--44727575266Total10015719819675726

28. Research Findings

29. Models

30. Final ModelsExpected number of crashes are associated with available ISDModels depend on:Available ISDMajor road AADTPosted speedOperational and geometric characteristics significantly associated with higher crash frequency:Major/minor road AADTFour-leg intersection indicatorLeft-direction indicatorVertical grade on major road approachSpeed limit on the major road approach

31. Model ConsiderationsSafety effects of available ISD differ by volume and speed limitPractitioners should use this information when possibleIf not available, practitioners can use average conditionsModel estimations describe relationship between target crash frequency, available ISD, and other intersection characteristicsAvailable for target crashes and target fatal and injury crashesTarget fatal and incapacitating injury crashes, target angle crashes, and target daytime crashes revealed similar trends between crash frequency and ISD

32. Target CrashesThree main variables capturing safety effects of available ISD and estimated parameters:Speed Limit/ISD interaction (spdlmt/ISD)Major road AADT/ISD interaction (LmajAADT/ISD)Major road AADT/ISD interaction (MmajAADT/ISD)Major road AADT ranges:Low major road AADT: ≤ 5,000Mid major road AADT: > 5,000 but ≤ 15,000High major road AADT: > 15,000

33. Model Estimation Results for Expected Number of Target CrashesVariableCoefficientStandardErrorZ-ScoreP-ValueConstant-8.1471.382-5.90<0.001β1 (log-majAADT)0.2440.1202.040.042β2 (log-minAADT)0.5360.0727.42<0.001β3 (LmajAADT/avaiISD)-243.0185.3-1.310.190β4 (MmajAADT/avaiISD)-177.886.53-2.060.040β5 (LT)0.3340.1202.790.005β6 (fourleg)0.8450.1266.68<0.001β7 (median)-0.0160.166-0.090.925β8 (spdlmt)-0.0210.008-2.750.006β9 (spdlmt/ISD)7.1942.4502.940.003β10 (grd500)-0.0610.026-2.320.021β11 (lnT)1 (exposure)Dispersion (α)2.660.278  N = 1653; Log-likelihood = -1296.89; Pseudo R2 = 0.055

34. Target Crashes CMFunctionsWhere: = Target crash CMF for condition of interest i (where i = 1 for proposed condition and i = 2 for existing condition).PSL = Posted speed (in mph).LowAADTmaj = 1 if major road AADT ≤ 5,000; otherwise 0.MidAADTmaj = 1 if 5,000 < major road AADT ≤ 15,000; otherwise 0.ISDi = Proposed or existing available intersection sight distance for the condition of interest i (where i = 1 for proposed condition and i = 2 for existing condition) (in ft).ISDbase = Base intersection sight distance for an approach direction (in ft). For practical applications, this values is assumed to be 1,320 ft. 

35. Target Crashes CMF for Approach DirectionWhere: = CMF for target crashes for an approach direction. Note: Compute the CMF for target crashes for an approach direction by using the proposed ISD in the numerator and using the existing ISD condition as the base ISD when calculating the target crash CMF for condition of interest 

36. Target Fatal and Injury CrashesGeneral trends and directions of safety effects were consistent with target crash modelMajor road AADT categories:Low-mid major road AADT: ≤ 15,000High major road AADT: > 15,000

37. Model Estimation Results for Expected Number of Target Fatal and Injury CrashesVariableCoefficientStandardErrorZ-ScoreP-ValueConstant-8.2341.431-5.75<0.001β1 (log-majAADT)0.1150.1170.980.325β2 (log-minAADT)0.4980.0905.55<0.001β3 (LMmajAADT/avaiISD)-155.5108.6-1.430.152β4 (LT)0.5070.1523.330.001β5 (fourleg)0.9530.1625.89<0.001β6 (median)0.2150.2101.030.305β7 (spdlmt)-0.0090.010-0.950.340β8 (spdlmt/ISD)6.3352.9152.170.030β9 (grd500)-0.0540.035-1.540.125β10 (lnT)1 (exposure)Dispersion (α)3.1360.155  N = 1653; Log-likelihood = -820.79; Pseudo R2 = 0.049

38. Target Fatal and Injury Crashes CMFunctionsWhere: = Target fatal and injury crash CMF for condition of interest i (where i = 1 for proposed condition and i = 2 for existing condition).LowMidAADTmaj = 1 if major road AADT ≤ 15,000; otherwise 0. 

39. Target Fatal and Injury Crashes CMF for Approach DirectionWhere: = CMF for target fatal and injury crashes for an approach direction.Note: Compute CMF for target fatal and injury crashes for an approach direction by using the proposed ISD in the numerator and using the existing ISD condition as the base ISD when calculating the target fatal and injury crash CMF for condition of interest. 

40. Unknown AADTIf AADT and posted speed are known, the charts provide a more informed estimate of safety impactsReduced versions of the CMFunctions may be applied for situations where major AADT and posted speed are unknownTarget CrashesTarget Fatal and Injury Crashes 

41. Application

42. Guidance for Evaluating the Safety Impacts of Intersection Sight DistancePurpose: Serve as a resource for evaluating intersection safetyAudience: Practitioners in planning, design, operations, and traffic safety management of stop-controlled intersectionsScope: Three- and four-leg intersections Stop-control on the minor road approachesPlanned and existing conditions

43. Guidance OrganizationChapter I: IntroductionChapter IIChapter IIIChapter IVChapter VChapter VI

44. Guidance OrganizationChapter IChapter II: Measuring Sight Distance & Other Critical InformationChapter IIIChapter IVChapter VChapter VI

45. Guidance OrganizationChapter IChapter IIChapter III: Safety Performance & Intersection Sight Distance Chapter IVChapter VChapter VI

46. CMFunction Charts in the GuidanceCharts A-1 to A-6CMFunctions for target crashesCharts B-1 to B-6CMFunctions for target fatal and injury crashes

47. Step 1. Identify the minor road approach sight distance of interest (left-looking or right-looking) for which a new ISD is proposed. Measure the sight distance along the major road for that direction using the method in Chapter II. This is the existing ISD for the approach and direction.

48. Step 2. Identify the type of crash of interest for the analysis: Target or Target Fatal or Injury Crash.Target crashes are defined as a crash involving a vehicle from the major road and a vehicle entering from the minor road.Target fatal and injury crashes are a subset of target crashes that involve one or more injuries or fatalities.

49. Step 3. Identify the appropriate chart type based on the type of crash and major road posted speed.

50. Step 4. Identify the curve that corresponds with the appropriate major road AADT range.Three ranges of major road AADT are used for target crashes.Two ranges of major road AADT are used for target fatal and injury crashes.

51. Step 5. Using the selected curve, plot the existing and the proposed ISD. If any ISD exceeds 1,320 ft, use 1,320 ft in the chart as this is the maximum.

52. Guidance OrganizationChapter IChapter IIChapter IIIChapter IV: ExamplesChapter VChapter VI

53. Example: One-direction ISD UpgradeThree-leg intersection Stop-control on the minor road approach Major road AADT = 7,000, speed = 55 mphExisting left-looking ISD = 400 feetHow would increasing left-looking ISD to 750 ft affect target crashes at this intersection?

54. Example: One-direction ISD Upgrade

55. Example: One-direction ISD UpgradeResulting CMF = 0.77Applies to: Multi-vehicle crashes involving vehicles from the minor road Vehicles approaching from the leftIncreasing left-looking ISD from 400 ft to 750 ft would reduce target crashes on the approach by 23 percent at this intersection.

56. Guidance OrganizationChapter IChapter IIChapter IIIChapter IVChapter V: Other Considerations and ResourcesChapter VI

57. Countermeasures Clear sight triangles as much as possible without geometric improvements. Geometric improvements to improve ISD. Increase awareness and visibility of the intersection. Warn drivers of presence of conflicting vehicles. Choose appropriate traffic control. Better accommodations for pedestrians and bicyclists.

58. Guidance OrganizationChapter IChapter IIChapter IIIChapter IVChapter VChapter VI: Base Equations for Reference

59. Project Conclusions

60. NCHRP 17-59 Summary Established methods for collecting available ISDDeveloped analytical models based on data to explore relationship between crashes, available ISD, and other factorsResulted in two multivariable count regression models: target crashes and target fatal and injury crashesDeveloped stand-alone guidance for practitioners to assess safety impacts of ISD

61. Future DirectionsIncorporate results of NCHRP 17-59 into existing policies, practices, and design manualsExplore the difference in CMFs for intersections with higher ISD-related crash countsConsider the impact of right-turns on the major roadsExplore effects of dynamic ISD on safetyExamine relationship between available ISD and total crashesExplore safety effects of roadside visual clutter

62. Stephan Parker | saparker@nas.eduKim Eccles | keccles@vhb.com Dr. Scott Himes | shimes@vhb.com Dr. Timothy Gates | gatestim@msu.eduDr. Christopher Monsere | Monsere@pdx.edu www.vhb.comOffices located throughout the east coast