PPT-How can we use the normal distribution curve to find percentages and amounts?
Author : debby-jeon | Published Date : 2018-11-09
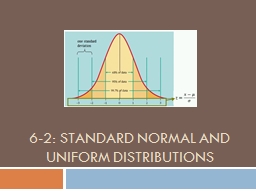
The Standard Deviation percentages can be broken into smaller percentage parts On the 5 th slide you saw the one standard deviation above and below the mean contained
Presentation Embed Code
Download Presentation
Download Presentation The PPT/PDF document "How can we use the normal distribution c..." is the property of its rightful owner. Permission is granted to download and print the materials on this website for personal, non-commercial use only, and to display it on your personal computer provided you do not modify the materials and that you retain all copyright notices contained in the materials. By downloading content from our website, you accept the terms of this agreement.
How can we use the normal distribution curve to find percentages and amounts?: Transcript
Download Rules Of Document
"How can we use the normal distribution curve to find percentages and amounts?"The content belongs to its owner. You may download and print it for personal use, without modification, and keep all copyright notices. By downloading, you agree to these terms.
Related Documents