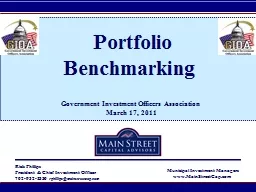
/
Rick Phillips President & Chief Investment Officer Rick Phillips President & Chief Investment Officer

Rick Phillips President & Chief Investment Officer - PowerPoint Presentation

debby-jeon
debby-jeon . @debby-jeon
Follow
373 views
Uploaded On 2018-02-26

Rick Phillips President & Chief Investment Officer - PPT Presentation

7029325330 rphillipsmainstreetcapcom Portfolio Benchmarking Government Investment Officers Association March 17 2011 Municipal Investment Managers wwwMainStreetCapcom Municipal Investment Managers ID: 637010

investment 000 mainstreetcap return 000 investment return mainstreetcap www managers municipal total portfolio book period interest 2011 month 100

Share:

Link:

Embed:

Download Presentation from below link

Download Presentation The PPT/PDF document "Rick Phillips President & Chief Inve..." is the property of its rightful owner. Permission is granted to download and print the materials on this web site for personal, non-commercial use only, and to display it on your personal computer provided you do not modify the materials and that you retain all copyright notices contained in the materials. By downloading content from our website, you accept the terms of this agreement.


Presentation Transcript

Slide1

Rick Phillips

President & Chief Investment Officer

702-932-5330 rphillips@mainstreetcap.com

Portfolio Benchmarking

Government Investment Officers Association March 17, 2011

Municipal Investment Managers

www.MainStreetCap.comSlide2

Municipal Investment Managers

www.MainStreetCap.com

2

Disclosure

The views expressed herein are those of the speaker and do not necessarily represent the views of Main Street Capital Advisors. Views are based on data available at the time of this presentation and are subject to change based on market and other conditions. Main Street cannot guarantee the accuracy or completeness of any statements or data. The information provided does not constitute investment advice and it should not be relied upon as such. It is not a solicitation to buy and/or an offer to sell securities. It does not take into account any investor’s particular investment objectives, strategies, tax status, or investment horizons. All material has been obtained from sources believed to be reliable, but we make no representation or warranty as to its accuracy and you should not place any reliance on this information. Past performance is no guarantee of future results

.

© Copyright 2011 Main Street Capital Advisors, LLC. All Main Street logos, trademarks and service marks appearing herein are property of Main Street Capital Advisors, LLC. This document may not be copied or distributed by the recipient. This document is provided for informational purposes only.Slide3

Municipal Investment Managers

www.MainStreetCap.com

3

GFOA Model Investment Policy

Safety:

Safety of principal is the foremost objective of the investment program. Investments shall be undertaken in a manner that seeks to ensure the preservation of capital in the overall portfolio. The objective will be to mitigate credit risk and interest rate risk.

Liquidity:

The investment portfolio shall remain sufficiently liquid to meet all operating requirements that may be reasonably anticipated. This is accomplished by structuring the portfolio so that securities mature concurrent with cash needs to meet anticipated demands (static liquidity). Furthermore, since all possible cash demands cannot be anticipated, the portfolio should consist largely of securities with active secondary or resale markets (dynamic liquidity). A portion of the portfolio may be placed in money market mutual funds or local government investment pools, which offer sameday liquidity for short-term funds.

Yield:

The investment portfolio shall be designed with the objective of attaining a market rate of return

throughout budgetary and economic cycles, taking into account the investment risk constraints and liquidity needs

. Return on investment is of secondary importance compared to the safety and liquidity objectives described above.

The core of investments are limited to relatively low risk securities in anticipation of earning a

fair return

, relative to the risk being assumed

.

Securities shall generally be held until maturity, with the following exceptions:

A security with declining credit may be sold early to minimize loss of principal.

A security swap would improve the quality, yield, or target duration in the portfolio.

Liquidity needs of the portfolio require that the security be sold.Slide4

Municipal Investment Managers

www.MainStreetCap.com

4

Presentation Summary

Discuss

Pros

and

Cons

and

the

Mechanics

of

each method of benchmarking:

So

you can determine which type of benchmarking is

appropriate

and

suitable

for your entity

.

Main Takeaways

You

Should Benchmark the Portfolio

The Benchmark Needs to be RelevantSlide5

Municipal Investment Managers

www.MainStreetCap.com

5

Primary Factors to Consider

To Be Relevant, Benchmarks

S

hould

R

eflect the

General

C

haracteristics

of a Portfolio’s:

Sector Allocations

Duration/Maturity

Turnover Slide6

Municipal Investment Managers

www.MainStreetCap.com

6

Municipal Portfolio Structure: Typical Allocation

Sector

Target Allocation %

Money Markets

20%

Treasuries

10%

Agencies


Bullets (non-call)

40%

Callables

30%

Total

100%

More than One Benchmark Component is Usually Needed--CustomizeSlide7

Municipal Investment Managers

www.MainStreetCap.com

7

Keeping Score of Your Portfolio

Yield Return

Book Return

Total ReturnSlide8

Municipal Investment Managers

www.MainStreetCap.com

8

Yield Return

Portfolio’s Month End Average Weighted Book/Purchase Yield

Security

Maturity

Duration

Wgt

Dur

Par Value

% of Portfolio

Book

Yld

Wgt

Yld

LGIP

3/1/2011

0.00

0.00

5,000,000

4.00%

0.15%

0.01%

Agency

3/31/2011

0.08

0.01

10,000,000

8.00%

0.20%

0.02%

Treasury

4/30/2011

0.17

0.01

10,000,000

8.00%

0.25%

0.02%

Agency

5/31/2011

0.25

0.02

10,000,000

8.00%

0.20%

0.02%

Treasury

6/30/2011

0.33

0.03

10,000,000

8.00%

0.30%

0.02%

Agency

7/31/2011

0.42

0.03

10,000,000

8.00%

0.25%

0.02%

Treasury

8/31/2011

0.50

0.04

10,000,000

8.00%

0.35%

0.03%

Agency

9/30/2011

0.59

0.05

10,000,000

8.00%

0.30%

0.02%

Treasury

10/31/2011

0.67

0.05

10,000,000

8.00%

0.35%

0.03%

Agency

11/30/2011

0.75

0.06

10,000,000

8.00%

0.30%

0.02%

Treasury

12/31/2011

0.84

0.07

10,000,000

8.00%

0.40%

0.03%

Agency

1/31/2012

0.92

0.07

10,000,000

8.00%

0.35%

0.03%

Treasury

2/29/2012

1.00

0.08

10,000,000

8.00%

0.40%

0.03%

Total


0.52

125,000,000

100.00%


0.30%Slide9

Municipal Investment Managers

www.MainStreetCap.com

9

Yield Return - Custom Benchmark

Sector Weight

LGIP 4%

Treasury* 48%

Agency# 48%

Total 100%

Month-End Yields:

*GB1=1 Yr T-Bill

#AGDN360Y= 1Yr Agency

Yld

Mar-10

Apr-10

May-10

Jun-10

Jul-10

Aug-10

Sep-10

Oct-10

Nov-10

Dec-10

Jan-11

Feb-11

LGIP Yld

0.19

0.18

0.20

0.22

0.23

0.23

0.21

0.21

0.22

0.20

0.19

0.19

Tsy

Yld

0.38

0.38

0.32

0.31

0.28

0.23

0.25

0.21

0.26

0.27

0.24

0.24

Agy

Yld

0.48

0.50

0.49

0.44

0.34

0.30

0.26

0.24

0.29

0.24

0.21

0.22


Wgt

4%

4%

4%

4%

4%

4%

4%

4%

4%

4%

4%

4%

Tsy

48%

48%

48%

48%

48%

48%

48%

48%

48%

48%

48%

48%

Agy

48%48%48%48%48%48%48%48%48%48%48%48%             Wgt Yld0.420.430.400.370.310.270.250.220.270.250.220.23

1.14% 12 Month Moving Avg

Jun 08 to May 09Slide10

Municipal Investment Managers

www.MainStreetCap.com

10

Yield Return: Pros and Cons

Pros:

Ease of Calculation

Ease of Understanding (presenting to governing boards)

Helpful for Budgeting Interest Income

Cons:

Does Not Account for Realized Capital Gains or Losses

Subject to Yield To Maturity AssumptionsSlide11

Municipal Investment Managers

www.MainStreetCap.com

11

Yield to Maturity Assumption

Step-Up Example: 5 Year Maturity, Annual 1% Steps, Purchased at Par

Coupons:

Yr 1 -- 1%

Yr 2 -- 2%

Yr 3 -- 3%

Yr 4 -- 4%

Yr 5 -- 5%

Avg -- 3%

What is the YTM?

1% or 3% or %?

Future

Coupon Payments Are Reinvested at the

Purchase YieldSlide12

Municipal Investment Managers

www.MainStreetCap.com

12

Book Return

+ Accrued/Received Interest

+/- Amortization or Premiums/Discounts

+/- Realized Gains/Losses

Average Daily Book Balance for the Period

= Book ReturnSlide13

Municipal Investment Managers

www.MainStreetCap.com

13

Total Return

+ Accrued/Received Interest

+/- Amortization or Premiums/Discounts

+/- Realized Gains/Losses

+/- Unrealized Gains/Losses

Time Weighted Invested Value for the Period

(Market Value Based)

= Total ReturnSlide14

Public Fund Investment Managers

www.MainStreetCap.us

14

Interest Rates Decline 50 Basis Points for the Month

Calculation of Return

Book Return vs

Total Return

Interest Collected

300,000

Plus Accrued Interest at End of Period

150,000

Less Accrued Interest at Beginning of Period

(100,000)

Less Accrued Interest at Purchase During Period

(50,000)

Interest Earned During Period

300,000


Adjusted by Premiums and Discounts

50,000

Adjusted by Realized Capital Gains or Losses

100,000

Adjusted by Mark-to-Market

N/A

Earnings During Period

450,000


Daily Weighted Balance for Period

100,000,000


Book Rate of Return - Period

0.45%

Book Rate of Return - Annualized

5.40%

Interest Collected

300,000

Plus Accrued Interest at End of Period

150,000

Less Accrued Interest at Beginning of Period

(100,000)

Less Accrued Interest at Purchase During Period

(50,000)

Interest Earned During Period

300,000


Adjusted by Premiums and Discounts

N/A

Adjusted by Realized Capital Gains or Losses

100,000

Adjusted by Mark-to-Market

750,000

Earnings During Period

1,050,000


Daily Weighted Balance for Period

100,000,000


Total Rate of Return - Period

1.05%

Total Rate of Return - Annualized

12.60%

Mark-to-Market: $100,000,000 x 1.5 duration x .50%= $750,000 Slide15

Municipal Investment Managers

www.MainStreetCap.com

15

Book Return – Under the Hood

Sample Benchmark Composition:

(Combined Liquidity and Core Portfolio)

Sector

Maturity

Index

Bberg

Ticker

Moving Average

LGIP

1 Day

LGIP

N/A

Monthly Distb. Rate

Agy

Discount Notes

0-6 Months

3 Mon

Discount Notes

AGDN090Y

6 Month

Commercial

Paper

0-3 Months

A1/P1 45 Day Dealer CP

DCPB045Y

3 Month

CDs

0-3 Months

A1/P1 45 Day CDs

DCDB45D

3 Month

Agy

Bullets

1-3 Years

1-3 Yr Agency Bullets

G1PB

12 Month

Agy

Callables

1-3 Years

1-3 Yr Agency Callables

G1PC

12 Month

T-Notes

1-3 Years

1-3 Yr Treasuries

G102

12 Month

Corporate

Notes

1-3 Years

1-3 Yr Corp Notes A-AAA

C1A1

12 MonthSlide16

Municipal Investment Managers

www.MainStreetCap.com

16

Yield & Book Return Benchmark

The

viewsSlide17

Municipal Investment Managers

www.MainStreetCap.com

17

Moving Average Benchmarks

Date

12 MMA

24 MMA

Var

Dec-01

3.70

4.95

-1.25

Dec-02

2.55

3.12

-0.58

Dec-03

1.64

2.09

-0.45

Dec-04

2.41

2.02

0.38

Dec-05

3.89

3.15

0.74

Dec-06

4.80

4.35

0.45

Dec-07

4.26

4.53

-0.27

Dec-08

1.91

3.09

-1.17

Dec-09

0.95

1.43

-0.48

Dec-10

0.65

0.80

-0.15

Avg

2.68

2.95

-0.28Slide18

Municipal Investment Managers

www.MainStreetCap.com

18

Book Return: Pros and Cons

Pros:

Matches Budgeting Process

Closely Matches Actual Cash Flows

Cons:

Subject to Manipulation of Realized Gains/Losses

May Not Reflect Portfolio’s Market Volatility Changes

(The Primary Reason for GASB 31)Slide19

Municipal Investment Managers

www.MainStreetCap.com

19

Total Return Parameters/Rules

Bank of America/Merrill Lynch 1-3 Year Treasury and Agency Index

(Ticker: G1A0)

Issue Size: $250 Million and Up (Agy*), $1 Billion and Up (Tsy*)

Monthly Rebalanced

Index “Buys” all Tsy and Agy Fixed Rate Securities Between 1-3 Yrs

Index “Sells” all Tsy and Agy Fixed Rate Securities Less Than 1 Yr

“Buys” Newly

A

dded Securities at the Bid Side – Worth about 12’ish Basis Points Annually

*Non-Subordinated # Non-TIPSSlide20

Municipal Investment Managers

www.MainStreetCap.com

20

1-3 Yr Govt Index Sector Allocation

Sector

Percent

Tsy

76.2%

FNMA

7.4%

FHLMC

6.6%

FHLB

4.7%

FFCB

0.8%

TVA

0.2%

Corp FDIC

4.1%

Total

100%Slide21

Municipal Investment Managers

www.MainStreetCap.com

21Slide22

Municipal Investment Managers

www.MainStreetCap.com

22

% of

Mkt

Val

Bullets 95.2%

Calls 4.8%

# of Issues

Bullets 260

Calls 231Total 491% of IssuesBullets 53%Calls 47%Slide23

Municipal Investment Managers

www.MainStreetCap.com

23

1-3 YR Govt Index Duration

Oct 2010

Jan 2011

Mar 2010

1.82

1.74

Month-End

Month-Start

DurationSlide24

Municipal Investment Managers

www.MainStreetCap.com

24

1-3 YR Govt

Callable Index

Duration

Oct 2010

Jan 2011

Mar 2010

DurationSlide25

Municipal Investment Managers

www.MainStreetCap.com

25

*Book Return= 12 Mon Moving Avg of Index Month-End YieldSlide26

Municipal Investment Managers

www.MainStreetCap.com

26

1-3 Yr Govt Index Components of ReturnSlide27

Municipal Investment Managers

www.MainStreetCap.com

27

1-3 Govt Index:

Price* vs Coupon Return

1991 to 2010

Price Return*: .4% = .02%

Coupon Return: 99.6% = 5.25%

Total Return: 100.0% = 5.27%

Price Return=Mark-to-Market Change

Year

91

92

93

94

95

96

97

98

99

00

01

02

03

04

05

06

07

08

09

10

Avg

Price

3.2

-0.9

-0.9

-5.4

4.1

-1.2

0.2

0.6

-2.8

1.7

2.6

1.2

-1.7

-2.2

-1.8

0.0

2.5

2.6

-1.6

0.2

0.02

Coupon

8.5

7.2

6.4

6.0

6.9

6.2

6.4

6.4

5.9

6.4

5.8

4.7

3.7

3.2

3.5

4.2

4.6

4.1

2.8

2.2

5.25

Total

11.7

6.3

5.4

0.6

11.0

5.0

6.7

7.0

3.1

8.1

8.4

5.9

2.0

1.0

1.7

4.1

7.1

6.7

1.2

2.3

5.27

Book Return (Coupon) and Total Return are basically the same over the long run Slide28

Municipal Investment Managers

www.MainStreetCap.com

28

Total Return Implications

“The

total rate of return implies that a dollar of wealth is equally meaningful to the

investor,

whether that wealth is generated by the secure income from a 90-day Treasury bill or by the unrealized appreciation in the price of a share of common stock

(or bond).”

(

CFA Institute curriculum) Slide29

Municipal Investment Managers

www.MainStreetCap.com

29

Conclusions

To Adhere To the 3

rd

Object of Your Investment Policy-You Need to Benchmark Your Portfolio to See if

i

t’s Earning a

“Market Rate of Return”

It’s Okay to Use All Three Measures

Book Return and Total Return Are More Sophisticated Measures and Capture More Information

Book Return Is Generally More Congruent With Most Municipalities’ Budgeting Programs

Total Return Captures the Mark-to-Market Volatility of a Portfolio