/
Slide   1 2-5 GRAPHS OF EXPENSE AND REVENUE FUNCTIONS Slide   1 2-5 GRAPHS OF EXPENSE AND REVENUE FUNCTIONS

Slide 1 2-5 GRAPHS OF EXPENSE AND REVENUE FUNCTIONS - PowerPoint Presentation

debby-jeon
debby-jeon . @debby-jeon
Follow
366 views
Uploaded On 2019-12-09

Slide 1 2-5 GRAPHS OF EXPENSE AND REVENUE FUNCTIONS - PPT Presentation

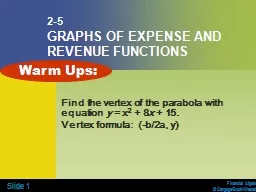
Slide 1 25 GRAPHS OF EXPENSE AND REVENUE FUNCTIONS Find the vertex of the parabola with equation  y   x 2   8 x   15 Vertex formula b2a y Warm Ups Slide 2 25 GRAPHS OF EXPENSE AND REVENUE FUNCTIONS ID: 769788

function slide parabola revenue slide function revenue parabola equation expense graph vertex price coefficient quadratic costs 000 points leading

Share:

Link:

Embed:

Download Presentation from below link

Download Presentation The PPT/PDF document "Slide 1 2-5 GRAPHS OF EXPENSE AND REVE..." is the property of its rightful owner. Permission is granted to download and print the materials on this web site for personal, non-commercial use only, and to display it on your personal computer provided you do not modify the materials and that you retain all copyright notices contained in the materials. By downloading content from our website, you accept the terms of this agreement.


Presentation Transcript

Slide 1 2-5GRAPHS OF EXPENSE AND REVENUE FUNCTIONS Find the vertex of the parabola with equation y = x2 + 8x + 15. Vertex formula: (-b/2a, y) Warm Ups:

Slide 2 2-5GRAPHS OF EXPENSE AND REVENUE FUNCTIONS Write, graph and interpret the expense function. Write, graph and interpret the revenue function. Identify the points of intersection of the expense and revenue functions. Identify breakeven points, and explain them in the context of the problem. OBJECTIVES

Slide 3 nonlinear function second-degree equation quadratic equation parabola leading coefficient maximum value vertex of a parabola axis of symmetry Key Terms

Nonlinear function - A function that has a graph that is not a straight line.Second-degree equation - A function with a variable raised to an exponent of 2.Quadratic equation - An equation written in the form y = ax2 + bx + c where a, b, and c are real numbers and a ≠ 0.Parabola - The shape of the graph of a quadratic function.Leading coefficient - The first coefficient in a quadratic equation when written in standard form, usually denoted by a. Maximum value - The peak or vertex of a parabola; the point where revenue can be maximized.Vertex of a parabola - The peak of the parabola and the point where revenue is maximized; the point of maximum value in a quadratic equation.Axis of symmetry - A vertical line that can be drawn through the vertex of a parabola so that the dissected parts of the parabola are mirror images of each other. Slide 4

Slide 5 How can expense and revenue be graphed?How does price contribute to consumer demand?Name some other factors that might also play a role in the quantity of a product consumers purchase. Why does a non-vertical line have slope but a nonlinear function does not?

Slide 6 Parabola with a positive leading coefficient

Slide 7 Parabola with a negative leading coefficient

Slide 8 Example 1 A particular item in the Picasso Paints product line costs $7.00 each to manufacture. The fixed costs are $28,000. The demand function is q = –500p + 30,000 where q is the quantity the public will buy given the price, p. Graph the expense function in terms of price on the coordinate plane.

Slide 9 An electronics company manufactures earphones for portable music devices. Each earphone costs $5 to manufacture. Fixed costs are $20,000. The demand function is q = –200 p + 40,000. Write the expense function in terms of q and determine a suitable viewing window for that function. Graph the expense function.CHECK YOUR UNDERSTANDING

Slide 10 Example 2 What is the revenue equation for the Picasso Paints product? Write the revenue equation in terms of the price.

Slide 11 Determine the revenue if the price per item is set at $25.00. CHECK YOUR UNDERSTANDING

Slide 12 EXAMPLE 3 Graph the revenue equation on a coordinate plane.

Slide 13 Use the graph in Example 3. Which price would yield the higher revenue, $28 or $40? CHECK YOUR UNDERSTANDING

Slide 14 The revenue and expense functions are graphed on the same set of axes. The points of intersection are labeled A and B. Explain what is happening at those two points.EXAMPLE 4

Slide 15 Why is using the prices of $7.50 and $61.00 not in the best interest of the company? CHECK YOUR UNDERSTANDING