/
Final Test Results for the Ground Operations Demonstration Unit for Li Final Test Results for the Ground Operations Demonstration Unit for Li

Final Test Results for the Ground Operations Demonstration Unit for Li - PDF document

delcy
delcy . @delcy
Follow
343 views
Uploaded On 2021-08-07

Final Test Results for the Ground Operations Demonstration Unit for Li - PPT Presentation

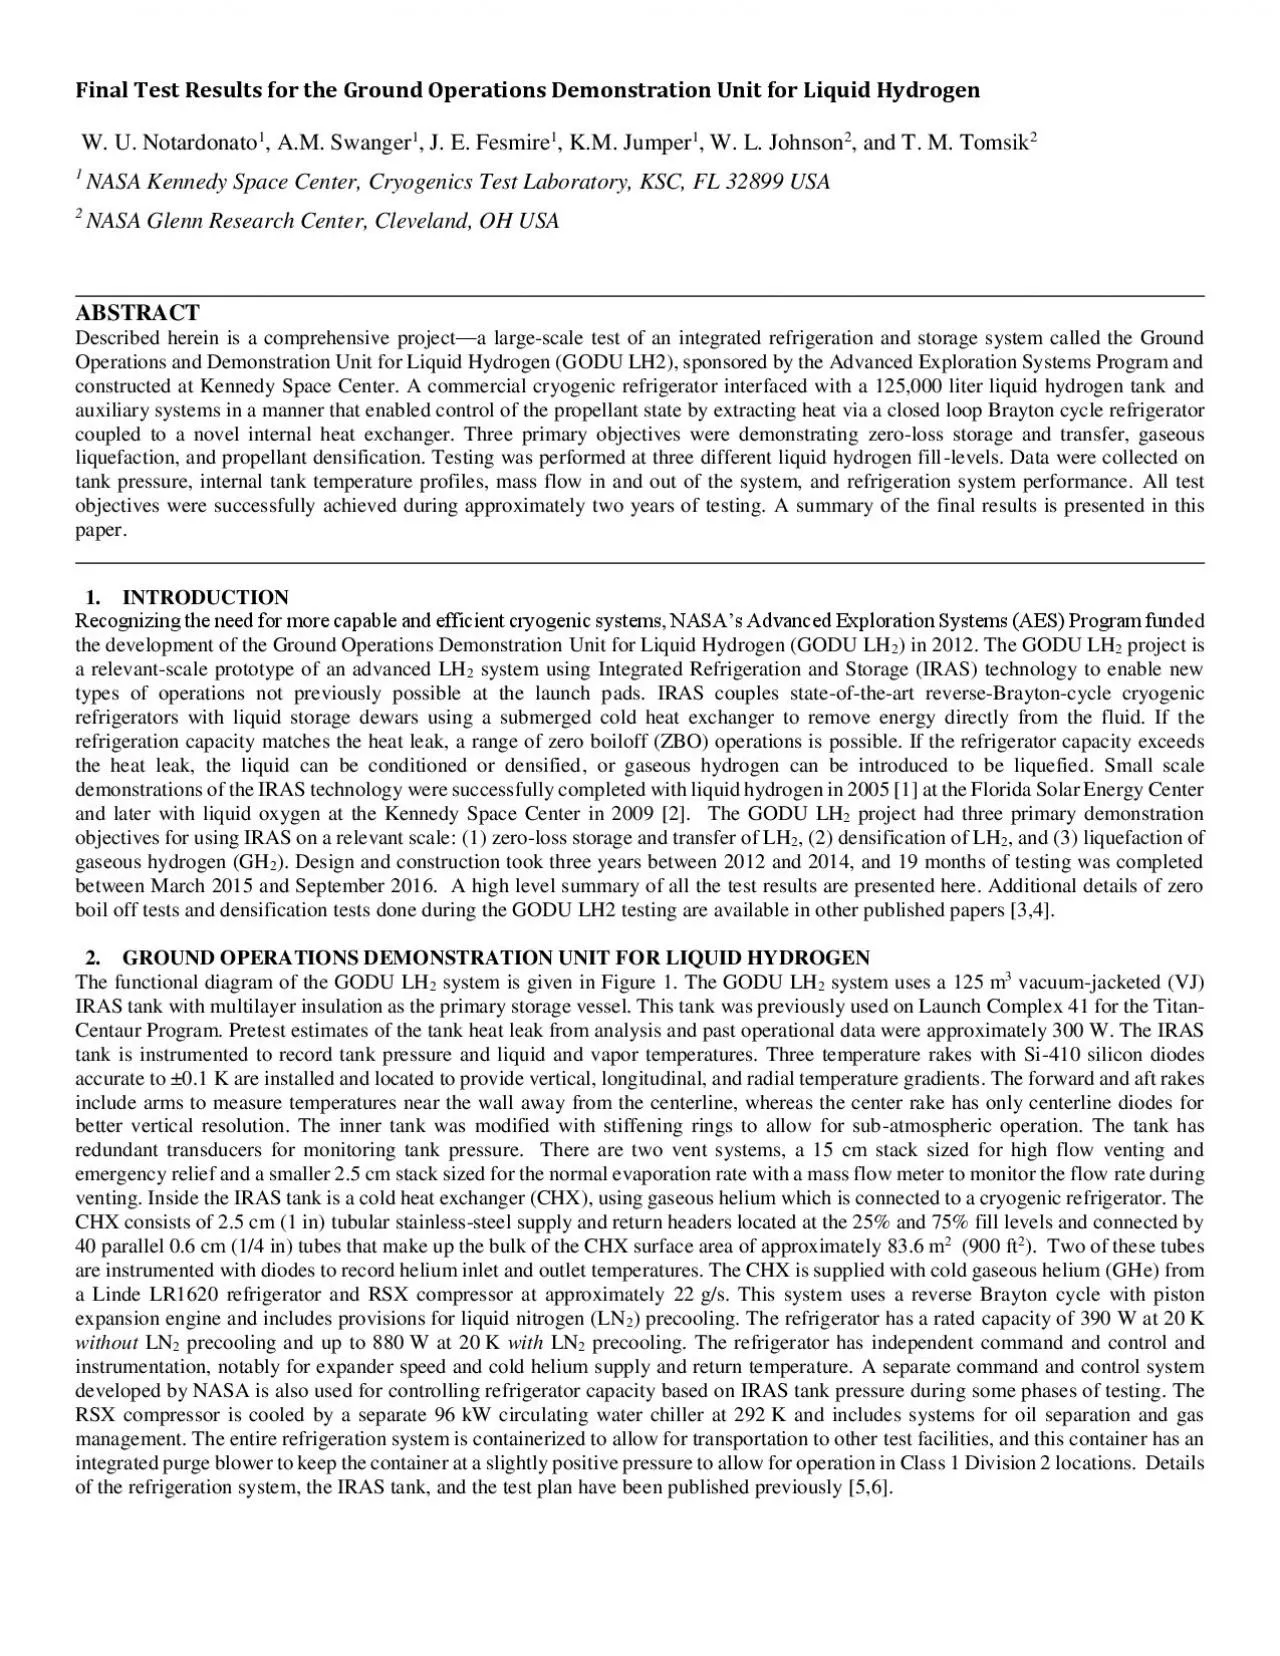
W U Notardonato1 AM Swanger1 J E Fesmire1 KM Jumper1 W L Johnson2 and T M Tomsik2 1NASA Kennedy Space Center Cryogenics Test Laboratory KSC FL 32899 USA2 NASA Glenn Research Center Cleveland OH USAABS ID: 859039

pressure tank test liquid tank pressure liquid test hydrogen system control testing refrigerator tests fill time temperature heat figure

Share:

Link:

Embed:

Download Presentation from below link

Download Pdf The PPT/PDF document "Final Test Results for the Ground Operat..." is the property of its rightful owner. Permission is granted to download and print the materials on this web site for personal, non-commercial use only, and to display it on your personal computer provided you do not modify the materials and that you retain all copyright notices contained in the materials. By downloading content from our website, you accept the terms of this agreement.


Presentation Transcript

1 Final Test Results for the Ground Operat
Final Test Results for the Ground Operations Demonstration Unit for Liquid Hydrogen W. U. Notardonato 1 , A.M. Swanger 1 , J. E. Fesmire 1 , K.M. Jumper 1 , W. L. Johnson 2 , and T. M. Tomsik 2 1 NASA Kennedy Space Center, Cryogenics Test Laboratory, KSC, FL 32899 USA 2 NASA Glenn Research Center, Cleveland, OH USA ABSTRACT Described herein is a comprehensive project — a large - scale test of an integrated refrigeration and storage system called the Ground Operations and Demonstration Unit for Liquid Hydrogen (GODU LH2), sponsored by the Advanced Exploration Systems Program and c onstructed at Kennedy Space Center. A commercial cryogenic refrigerator interfaced with a 125,000 liter liquid hydrogen tank and propellant state by extracting heat via a closed loop Brayton cycle r efrigerator coupled to a novel internal heat exchanger. Three primary objectives were demonstrating zero - loss storage and transfer, gaseous liquefaction, and propellant densification. Testing was performed at three different liquid hydrogen fill - levels. Da ta were collected on tank pressure, internal tank temperature profiles, mass flow in and out of the system, and refrigeration system performance. All test objectives were successfully achieved during approximately two years of testing. A summary of the fin al results is presented in this paper . 1. I NTRODUCTION ed the development of the Ground Operations Demonstration Unit for Liquid Hydrogen (GODU LH 2 ) in 2012. The GODU LH 2 project is a relevant - scale prototype of an advanced LH 2 system using Integrated Refrigeration and Storage (IRAS) technology to enable new types of operations not previously possible at the launch p ads. IRAS couples state - of - the - art reverse - Brayton - cycle cryogenic refrigerators with liquid storage dewars using a submerged cold heat exchanger to remove energy directly from the fluid. If t he refrigeration capacity matches the heat leak, a range of zero boiloff (ZBO) operations is possible. If the refrigerator capacity exceeds the heat leak, the liquid can be conditioned or densified . Small scale demonstrations of the IRAS technology were successfull y completed with liquid hydrogen in 2005 [1] at the Florida Solar Energy Center and later with liquid oxygen at the Kennedy Space Center in 2009 [2]. The GODU LH 2 project had three primary demonstration objectives for using IRAS on a relevant scale: (1) zero - loss storage and transfer of LH 2 , (2) densification of LH 2 , and (3) liquefaction of gaseous hydrogen (GH 2 ). Design and construction took three years between 2012 and 2014, and 19 months of testing was completed between March 2015 and September 2016. A high level summary of all the test results are presented here. Additional details of zero boil off tests and densification tests done during the GODU LH2 testing 2. GROUND OPERATIONS DEMONSTRATION UNIT FOR LIQUID HYDROGEN The functional diagram of the GODU LH 2 system is given in Figure 1. The GODU LH 2 system uses a 125 m 3 vacuum - jacketed (VJ) IRAS tank with multilayer insulation as the primary storage vessel. This ta nk was previously used on Launch Complex 41 for the Titan - Centaur Program. Pretest estimate s of the tank heat leak from analysis and past operational data were approximately 300 W. The IRAS tank is instrumented to record tank pressure and liquid and vapor temperatures. Three temperature rakes with Si - 410 silicon diodes accurate to ±0.1 K are installed . The forward and aft rakes include arms to measure temperatures near the wall away from the centerline, whereas the center rake has only centerline diodes for better vertical resolution. The inner tank was modified with stiffening rings to allow for sub - atmospheric operation. The tank has redundant transducers for monitoring tank pr essure. There are two vent systems, a 15 cm stack sized for high flow venting and emergency relief and a smaller 2.5 cm stack sized for the normal evaporation rate with a mass flow meter to monitor the flow ra

2 te during venting. Inside the IRAS tan
te during venting. Inside the IRAS tank is a c old heat exchanger (CHX), using gaseous helium which is connected to a cryogenic refrigerator. The CHX consists of 2.5 cm (1 in) tubular stainless - steel supply and return headers located at the 25% and 75% fill levels and connected by 40 parallel 0.6 cm (1 /4 in) 83.6 m 2 ( 900 ft 2 ). Two of these tubes are instrumented with diodes to record helium inlet and outlet temperatures. The CHX is supplied with cold gaseous helium (GH e) from a Linde LR1620 refrigerator and RSX compressor at approximately 22 g/s. This system uses a reverse Bray ton cycle with piston expansion engine and includes provisions for liquid nitrogen (LN 2 ) precooling. The refrigerator has a rated capacity of 390 W at 20 K without LN 2 precooling and up to 880 W at 20 K with LN 2 precooling. The refrigerator has independent command and control and A separate command and control system developed by NASA is also used for controlling refrigerator capacity based on IRAS tank pressure durin g some phases of testing. The RSX compressor is cooled by a separate 96 kW circulating water chiller at 292 K and includes systems for oil separation and gas management. The entire refrigeration system is containerized to allow for transportation to other test facilities , and this container has an integrated purge blower to keep the container at a slightly positive pressure to allow for operation in Class 1 Division 2 lo cations. Details of the refrigeration system, the IRAS tank, and the test plan have bee n published previously [ 5,6 ] . Figure 1 GODU LH2 functional diagram 3. TEST PLAN The GODU LH 2 test matrix includ es testing of each of the primary objectives at three different fill levels — 33%, 67%, and 100% — with one delivered tanker of LH 2 filling roughly ⅓ of the tank. Additional boil off testing occurred at each fill level to characterize the tank heat leak as a function of liquid level. T he zero - loss storage and transfer objective consisted of multiple tests split between ZBO tests sto rage tests and zero - loss chilldown and tanker offload transfer tests. The ZBO storage tests were performed at each liquid level using three different control methods: helium supply temperature control, IRAS tank pressure control, and on/off duty cycling. Temperature control tests used Linde software to control the helium refrigerant supply temperature to the tank. Pressure control tests used KSC developed software to control the refrigeration power based on tank pressure response. Both these tests used in ternal heaters in the refrigerator to vary the helium temperature as needed, thereby introducing heat into the system to allow for continuous control. The duty cycling tests did not provide for continuous control, instead refrigeration was supplied in bat ch processes at full power. None of the ZBO storage tests required LN2 precooling. For the zero - loss - transfer objective, all tanker supply operations were performed with no venting losses, saving roughly 1 3 % more of the delivered LH 2 quantity than typical KSC practices. After each no loss tanker offload was complete, a short boil off test was completed to characterize the tank heat leak at that fill level. The initial cooldown of the tank was also done using the refrigerator to cool the GH 2 in the tank to the normal boiling point ( NBP ) . These zero - loss transfer tests typically used LN2 precooling to maximize refrigerator capacity and minimize required test time . Densification tests were also conducted at each of the three liquid levels. Dur ing each densification test, all the tank liquid and vent valves are closed. The refrigerator is run at full power mode with LN 2 precooling active. During densification operations, the IRAS tank pressure and liquid temperature decrease as long as the refri gerator capacity is greater than the tank heat leak. No helium gas pressure is applied to the ullage, and the tank pressure go es below atmospheric pressure. W

3 hen the IRAS tank reaches the NBP, a low
hen the IRAS tank reaches the NBP, a low - pressure helium gas purge is applied to the stem seals an d backside of all isolation valves and around the perimeter of all the flanges to prevent the intrusion of atmospheric air in the event of a leak. Eventually the system reaches an equilibrium temperature where the c ryocooler refrigeration power equals the ambient heat load on the tank and refrigeration system. The pretest estimated minimum temperature for the system was 15 K. Data are collected on heat exchanger and refrigerator performance and on the response of the liquid and vapor in the tank Liquefaction testing was performed when the tank was at the 0%, 33% and 67% fill levels. There was no need to perform this test when the tank was 100% full. During liquefaction testing, the refrigerator is operated at full power and a mass flow controller introduces gaseous hydrogen into the tank at a rate that maintains constant pressure. During the system build phase, budget compromises force d the elimination of several key components from the liquefaction system . A liquid nitrogen pre - cooler with an int egrated ortho - para conversion bed was eliminated from the design, making the system thermodynamically inefficient at liquefying hydrogen. Testin g was conducted anyway, but due to the decreased importance of this objective in the near term , the tests were n ot as rigorous and repeatable as the other testing. 4. TEST RESULTS The Test Readiness Review for the GODU LH2 testing was completed in February 2015. At that time the IRAS tank had approximat ely 15 m 3 ( 4000 gallons ) of liquid nitrogen stored, and severa l weeks were needed to drain and purge all the nitrogen out of the system. Once the hydrogen concentration in the tank reached 99.5%, the refrigerator was turned on. By this time the tank temperatures had increased back to near 300 K and any tank precool ing from the LN2 cold shock was lost. The refrigerator was turned on and cooling to the tank was initiated in early April 2015. After several weeks the tank had reached 20 K and the first tanker offload was completed. Various ZBO tests were performed over the next several months as the operators gained experience in the system behavior and c ontrol PID loops were tuned. Numerous issues with refrigerator operations including helium leaks, valve adjustments, water chiller cooling and oil leaks at the compressor electrical feedthrus caused many delays and test interruptions during this time. Ultimately the oil leaks required re - servicing the compressor with oil, and using an o utdated procedure operators accidentally cause d the compressor oil separation system to be overloaded. This led to contamination in the cold box and the refrigerator was out of commission fro m early October 2015 until March 2016. The original load of liq uid hydrogen was lost during this time and testing was re - started in April 2016 with another tanker offload to refill the tank to the 33% fill level. From this point the timeline was compressed , and the majority of the test results were obtained between t his offload and October 2016, when the project was completed. Figure 2 below shows the tank pressure and liquid level during this timeline , and Table 1 gives the start and end dates of each individual test. Details on each of these tests are presented nex t. Table 1 . Individual testing dates Figure 2 . GODU - LH2 Testing Timeline 4.1 Zero - loss Storage and Transfer 4.1.1 Zero - loss Chilldown - By running the refrigeration system with GH2 in the IRAS tank, a zero - loss chill down was achieved. A plot of IRAS tank center rake temperatures and tank pressure over this time is shown in Figure 3. Over 920 hours, tank temperatures were reduced from approximately 290 K to approximately 21 K, with the tank pressure dropping fr om 345 kPa ( 50 psia ) to 103 kPa ( 15 psia ) , all while adding 109 kg of gaseous hydrogen. The hydrogen was added in batch processes and can be easily seen in the figur

4 e as spikes on the temperature and pre
e as spikes on the temperature and pressure plots. The refrigerator was running at full p ower during this operation with LN2 precooling active. A typical g r ound liquid hydrogen tank chill down from ambient temperature results in significant product losses. This is a new operational capability in large scale LH2 systems. On Earth this allows for more economical and safe system commissioning. But in space , the benefit is magnified by the cost of delivering the propellant, whether by resupply or from ISRU processes. Figure 3 . IRAS Temperature and Pressure during chilldown 4.1.2 Zero - loss Tanker Offload - Three zero - loss tanker offloads were performed. The initial offload took the tank from 0 - 33% full and was the conclusion of a zero - loss chilldown and fill process from a hot tank to a cold tank with no product losses. The offload from 3 3 - 67% was achieved with little difficulty, removing all the added energy in the system in less than 80 hours. The final tanker offload from VWE to 100E technically wasn’t zero - loss , because the full trycock was opened near the end of the process to verify the final full liquid level. D ata indicated the IRAS tank pressure increase was not to the point that the vent valve needed to be opened. In the future, addition of a wet/dry sensor at the full trycock level would eliminate the need for that minimal ven ting during the process of topping off the tank. Figure 4 shows the system pressure response after each tanker offload. An initial pressure spike is followed by a rapid depressurizat ion while the refrigerator works to de - stratify the tank and bring the u llage to saturated conditions. This is followed by a longer period when the refrigerator works to remove the energy from the bulk liquid. The initial tanker offload has the highest pressure spike due to the semi - warm tank , and details o f that offload are shown in Figure 5. For that test, t he time required to remove the heat and get the tank back to near atmospheric pressure is extended due to the refrigerator not being started until the next day. The steady dP/dt for the pressure reduction is approximat ely - 1.7 kPa/hr ( - 0.25 psi/hr ) during the time with LN2 precooling and - 0.35 kPa/hr ( - 0.05 psi/hr ) without LN2 precooling. The second tanker offload was the easiest, with pressure rising to only 172 kPa ( 25 psia ) . The time required to remove the energy was only 80 hours and the dP/dt was - 0.76 kPa/hr ( - 0.11 psi/hr ) with LN2 precooling. The final offload had a moderate pressure spike to 234 kPa ( 34 psia ) before the full trycoock valve was opened. The required co oling time was the longest of the three, taking 200 hours to remove all the heat. This test was done using the refrigerator without LN2 precooling, giving a dP/dt of just - 0.2 kPa/hr ( - 0.03 psi/hr ) . Figure 4 . I RAS Tank Pressure during tanker offload operations Figure 5. Pressure and center rake temp during 33% offload 4.1.3 Zero Boil Off - Pressure Control The GODU LH2 system was built with an ability to control the refrigeration power delivered using the tank press ure transducer as the feedback mechanism. The control software was written to use PT1 as the control point , and all results in this section are referenced to PT1. T o demonstrate full control of the tank pressure with the GODU - LH2 software , it was desirab le to test the response of the system when a set - point is chosen at both higher and lower values than the tank pressure at that time — to converge to the desired pressure from “above” and “below.” From aboveL the control logic allow s the refrigerator to run at maximum capacity to drop the pressure as fast as possible and then introduce heat until the refrigerator lift balances the tank heat leak. Whereas, from below, the software i ntroduce s excessive heat into the tank to drive the pressure up to the set - poin t. The standard ZBO - PC test sequence was to set the control

5 pressure to 18.0 psia, wait at least 2
pressure to 18.0 psia, wait at least 24 hours after stabilization, then decrease the control pressure to 17.5 psia, wait for at least 24 hours after stabilization, then increase the control press ure to 18.5 psia, stabilize, and finally decrease the control pressure to 16.5 psia. Figure 6 shows a typical ZBO pressure control test at 33% fill l evel. The ZBO testing using tank pressure as the control variable was completely successful. Not only di d the system show the ability to maintain the liquid hydrogen as a liquid with no losses for an indefinite time period, it demonstrated the ability to control the propellant to any storage condition desired. Testing at the three differe nt liquid levels sh owed excellent controllability , and the only difference between tests was the amount of time required to reach steady state after changing from one set point to the next. The pressure response is faster than the temperature response, but eventually the l i quid temperatures reach a steady state as well. 4.1.4 Zero Boil Off - Temperature Control The second method of zero boil off control is referred to as temperature control. The Linde refrigerator was supplied with a built in capability to control the sup ply temperature of the helium. M ore temperature control testing was conducted at the 33% fill level tha n the other fill levels. Temperature control testing with set points of 20 K, 19 K, 18 K 17 K and 16 K were all successfully completed during this time period as there was no hydrogen venting. The response time of the set point variable was very fast, reachin g the prescribed helium temperature via the internal heater in a matter of minutes. C omp lete pressure and temperature stabilization of the liquid hydrogen took a much longer time depending on how close the eventual equilibrium point was to the initial conditions. All these tests took a long time to stabilize , and so for later fill levels of 67% and 100% , testing was only conducted at 18 K for comparison purposes. The ZBO testing using temperature control of the helium supply met the test objectives. The system demonstrated the ability to maintain the LH2 in a liquid state indefinitely withou t venting. However, achieving a steady state condition was elusive as the fast helium temperature response time did not create an equally fast hydrogen storage response time . 4.1.5 Zero Boil Off – Duty Cycle Numerous zero boil off tests were conducted, both intentionally and unintentionally, in a manner where the refrigerator cycled off and then on. This was referred to a duty cycling. Of these numerous tests, one representative test was chosen at each liquid le vel to be presented in detail. Figure 7 s hows the tank pressure and center rake temperatures over time during the 33% fill level testing. These operations consisted of a period of time while the tank is self pressurizing and the ullage temperatures are stratifying, fol lowed by a period when the refrigerator is operating and the tank temperatures and pressures are decreasing. The depressurization rate is typically fast at the start while the ullage temperatures collapse to an isothermal state, followed by a period where the depressurizat ion rate slows as energy is removed from the bulk liquid. These tests were used to measure pressurization and depressurization rates, duty cycle ratios, and compare fluid behavior between the different liquid levels. Overall, ZBO Duty Cycle operations were accompl ished with great success . This demonstrates the ability of the IRAS system to remove the energy accumulated during the off cycle with a refrigeration on a cycle of roughly the same time period. There was zero vent loss at every test. Temperatures and pre ssures were not steady during the test period by definition of being on a cycle, but ending temperatures and pressures matched the c onditions at the start of the cycle . Figure 6 . ZBO Pressure Control Test at 33% fill level Figure 7 . ZBO Duty Cycle Test at 33% fill

6 level 4.2 Densification A primar
level 4.2 Densification A primary motivation for the GODU LH2 testing was to demonstrate the ability to cool the liquid hydrogen below the normal boi ling point, a process referred to a propellant densification. A comparison of the densification timelines for the different liquid levels is shown in Figure 8. As expected, the time required to change the storage state is directly proportional to the mass in the tank. The 33% fill test, corresponding to roughly 4080 kg of LH2, needed just 107 hours to densify to a saturated pressure of 24 kPa ( 3.5 psia ) , whereas the 67% fill test took 181 hours to densify to the same conditions, and the 100% fill test, with 8680 kg of LH2, took 298 hours. W hen the tank reaches the NBP, the 33% full tank is depressurizing at - 1 kPa/hr ( - 0.15 psi/hr ) , compared to - 0.69 kPa/hr ( - 0.10 psi/hr ) for the 67% full tank and just - 0.34 kPa/hr ( - 0.05 psi/hr ) for the 100% full tank. At the 33% and 67% fill levels, the data suggest that significant amounts of slush hydrogen were produced as LH2 temperatures were observed to stabilize and then drop below the triple point ( TP ) temperature of 13.8 K. In particula r, details of the 33% densification test are shown in Figure 9. This shows the tank center rake temperatures and tank pressure during the period the tank was subatmospheric , designated as T - 0, and the point when the refrigerator was turned off. The NBP a nd TP are shown for reference. In this test, TT3 and TT4 are liquid temperatures and the others are in the ullage. The liquid temperatures decrease until they stabilize below the TP. At this point a liquid - solid phase change is occurring and slush hydro gen is being produced. Data analysis of the tank heat leak and refrigerator capacity during this period allow for an estimate of the quantity of solid being produced, and preliminary estimates show a solid mass fraction of approximately 25%. After a perio d of time, these liquid temperatures again begin to decrease in temperature, below the TP, eventually reaching a minimum temperatu re of 12.8 K. This behavior remains somewhat unexplained as there was insufficient instrumentation in the system to allow for full understanding of this period of time. Possible explanations for this behavior are the ultra pure hydrogen forms supercooled f luid in the absence of solid nucleation sites, or more likely the system is in a non - homogenous state and some gaseous helium in the ullage is depressing the TP to below that of a pure substance. All three of the densification tests successfully met the pretest prediction of 15 K bulk liquid temperatures. The first two tests at the lower liquid levels reached the TP, and slush hydrogen was produced. The final test was progressing toward the TP, but testing was terminated due to the end of the project life at the end of fiscal year 2016 . This new capability is now available to further develop densified - propellant technology. Beca use the system was designed to be transportable, this new capability can be used at suitable engine test stands to provide densified hydrogen down to slush conditions for qualification testing. NASA is currently looking for i nterested partners to work in h elping develop this technology . Figure 8 . Tank Pressure during densification testing Figure 9. Pressure and temperature - 33% densification testing 4.3 Liquefaction The third primary test objective was to demonstrate liquefaction of gaseous hydrogen using IRAS. The intent at the start of the project was to use GH2 from a tube trailer and run it thru a liquid nitrogen pre - cooler with an integrated ortho - para conversion bed to create equilibrium hydrogen at 78 K. The r efrigerator would operate at full power and a steady controlled rate of GH2 would flow into the tank while maintaining isobaric conditions. Project funding was cut in 2013 due to sequestration and other issues , and this objective was de - emphasized in favo r of the ZBO and densificatio

7 n efforts. However, liquefaction was sti
n efforts. However, liquefaction was still achieved at each fill level , but the methods varie d between each level . Liquefaction testing at the 0% fill level was accomplished during the chill down test, as gaseous hydrogen was introduced into the tank in several batch processes as the tank pressure decreased during cooling (Figure 3 ) . The only continuous liquefaction test was performed at the 33% fill level, as the refrigerator was turned on at full power and hydrogen was intro duced into the tank via a mass flow controller. Th e MFC regulated the hydrogen gas flow to maintain constant pressure in the tank during the liquefaction process. Figure 10 below shows the tank pressure, liquid level, and hydrogen mass flow rate during t his test. Finally at the 67% fill level, liquefaction was achieved by a batch process of hydrogen flow while the tank was at subatmosph eric conditions raising the tank pressure back to 103 kPa ( 15 psia ) . In all, over 200 kg of hydrogen gas was liquefied during this testing, and future plans call for more steady liquefaction tests with pre - cooling and ortho - para conversion to better characterize the system behavior during this type of operation. Fi gure 10 . Liquefaction testing at the 33% fill level 5. CONCLUSION The GODU LH2 system has completed the ini tial round of functional tests using an Integrated Refrigeration and Storage method to remove heat from a cryogenic storage system. The system behavior depends on the refrigerator capacity compared to the heat leak of the tank. These tests have successfu lly demonstrat ed the three primary objectives : zero - loss storage and transfer, propellant densification, and hydrogen liquefaction. A zero - loss chilldown and three zero - loss tanker offloads successfully proved the capability to perform zero - loss cryogenic transfers. Three different zero boil off storage methods were tested at various fill levels to show the system capability for indefinite zero boil off storage. Most promising is the ZBO method using tank pressure as the control variable, as the system d emonstrated the ability to control the liquid to essentially any point along the saturation line. This testing also demonstrated the ability to reliably produce large quantities of densified hydrogen down to the triple point. 6 REFERENCES 1. Notardonato, W.U., Baik, J.H., and McIntosh, G.E., “Operational Testing of Densified Hydrogen Using G - M Refrigeration”, Advances in Cryogenic Engineering, Vol. 49, American Institute of Physics, New York, 2004 2. Notardonato , W.U. , Johnson, W.L., Oliveira , J , and Jumper , K. ; “ E xperimental R esults of I ntegrated R efrigeration and S torage S ystem T esting ” Advances in Cryogenic Engineering, Vol. 57 , American Institute of Physics, New York, 20 12 3. Notardonato , W.U. , Swanger , A.M , Fesmire , J.E. , Jumper , K.M. , Johnson , W.L. , and Tomsik , T.M.; “ Zero Boil - Off Methods for Large Scale Liquid Hydrogen Tanks using Integrated Refrigeration and Storage” ; Advances in Cryogenic Engineering, Vol 61, American Institute of Physics, New York, 2016 4. Notardonato , W.U. , Swanger , A.M , Fesmire , J.E. , Jumper , K.M. , Johnson , W.L. , and Tomsik , T.M.; “ Large Scale Production of Densified Hydrogen to the Triple Point and Below ”; Advances in Cryogenic Engineering, Vol 61, American Institute of Physics, New York, 2016 5. Swanger, A.M., Notardonato, W.U., and JumperL K.L “ASME Section VIII Recertification of a SSL000 Gallon Vacuum Jacketed LHR Storage Vessel for Densified Hydrogen Testing at NASA Kennedy Space CenterL” PVPR01U - 45625, Proceedings of the ASME 2015 Pressure Vessels & Piping Conference, July 19 - 23, 2015, Boston, Massachusetts, USA 6. J. E. FesmireL T. M. TomsikL T. BonnerL J. M. OliveiraL H. J. ConyersL W. L. JohnsonL and W. U. NotardonatoL “Integrated heat exchanger design for a cryogenic storage tank”L AIP Conference Proceedings 1UWSL 1SVU HR01TI; do i: 10.1063/1.486