/
Table 121  Anemia among women Table 121  Anemia among women

Table 121 Anemia among women - PDF document

dorothy
dorothy . @dorothy
Follow
342 views
Uploaded On 2022-10-13

Table 121 Anemia among women - PPT Presentation

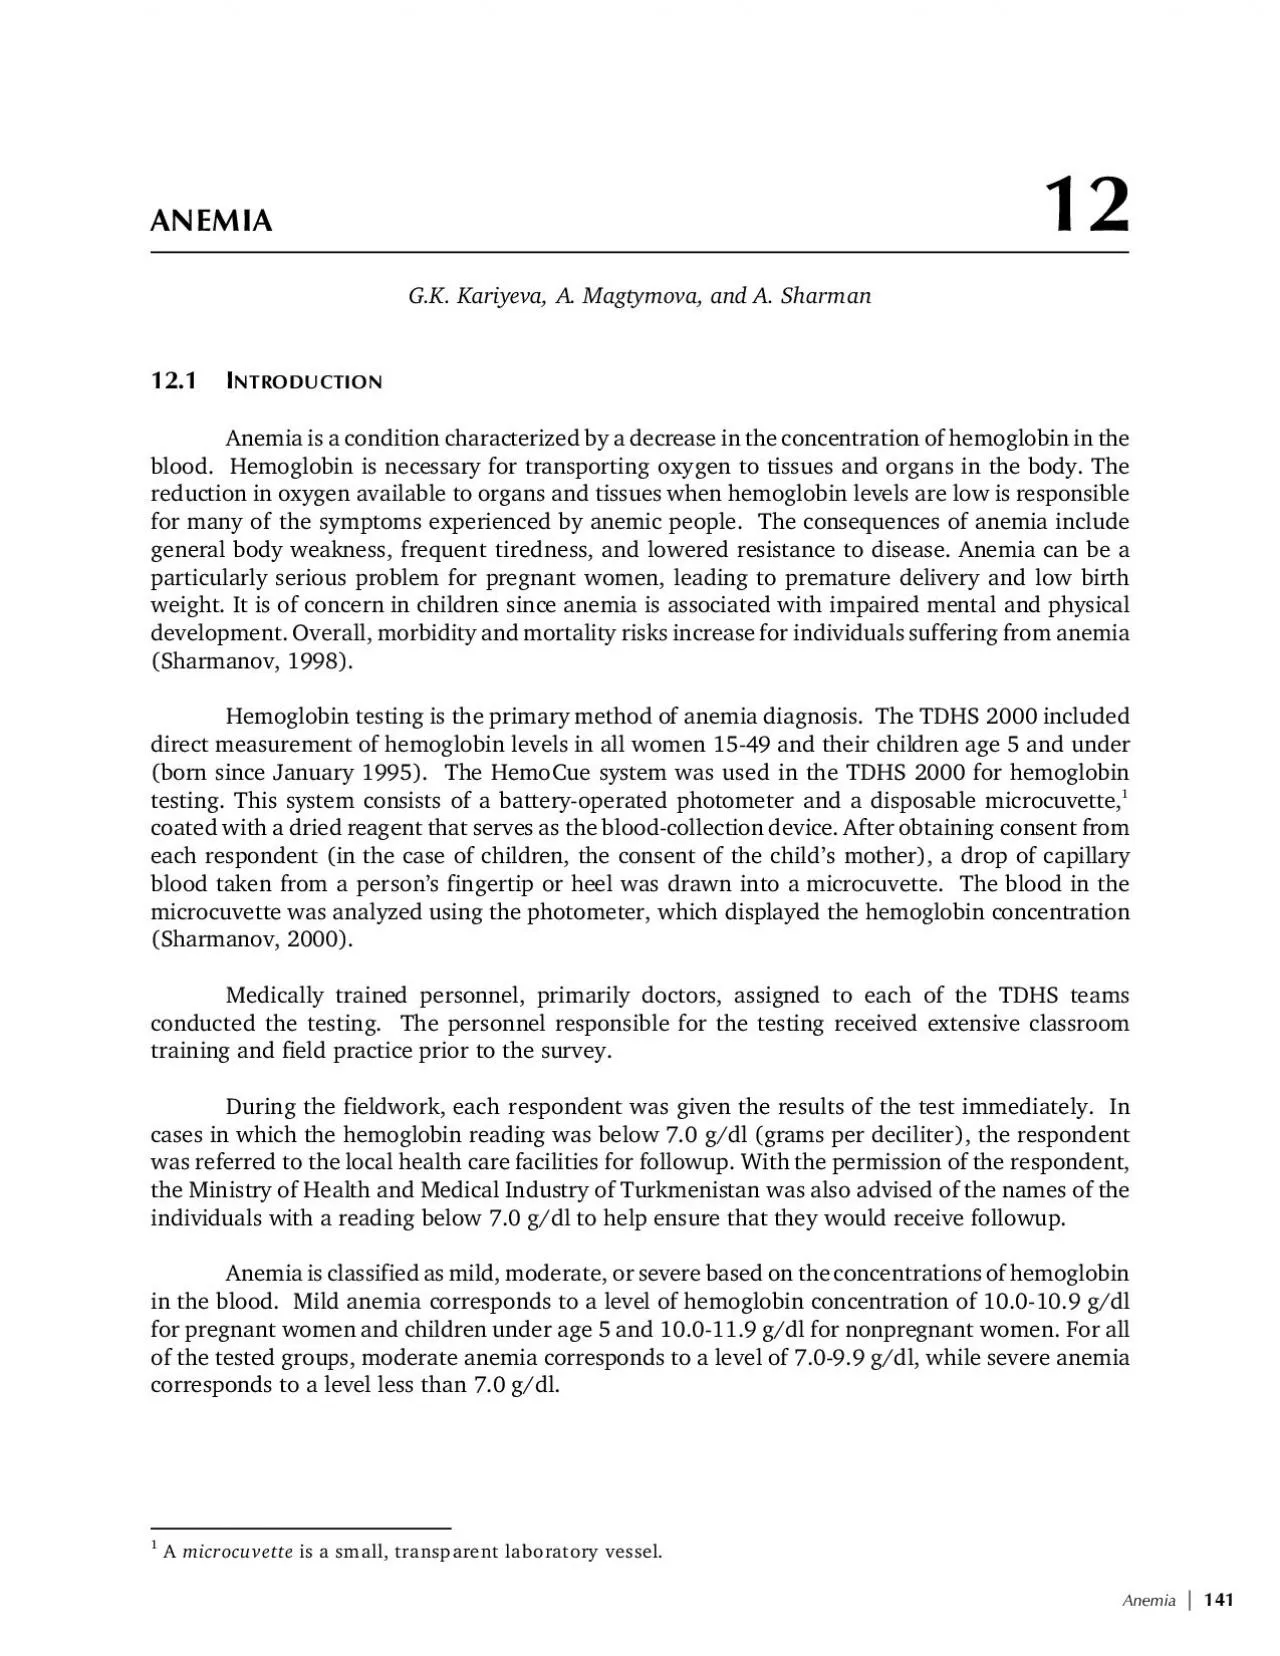
142 Anemia of women age 1549 classified as having anemia by background characteristics Turkmenistan 2000 Per ID: 959467

women anemia age percent anemia women percent age children moderate iron severe hemoglobin level population turkmenistan 2000 birth characteristics

Share:

Link:

Embed:

Download Presentation from below link

Download Pdf The PPT/PDF document "Table 121 Anemia among women" is the property of its rightful owner. Permission is granted to download and print the materials on this web site for personal, non-commercial use only, and to display it on your personal computer provided you do not modify the materials and that you retain all copyright notices contained in the materials. By downloading content from our website, you accept the terms of this agreement.


Presentation Transcript

142 * Anemia Table 12.1 Anemia among women of women age 15-49 classified as having anemia, by background characteristics, Turkmenistan 2000 ___ _________ ___________________________________________________ Percentage of women with anemia _________________________________________ Severe Moderate Mild Number characteristic anemia 1 anemia 2 anemia 3 measured ___ _____________________________________________________ ______ _ Age 15-19 0.5 4.1 33.0 1,534 20-24 0.6 7.1 38.6 1,507 25-29 1.3 9.6 38.4 1,228 30-34 1.3 9.5 43.4 1,028 35-39 1.4 10.6 38.6 943 40-44 1.4 11.3 38.5 832 45-49 1.8 10.2 35.3 642 Residence Urban 1.1 7.6 36.7 3,528 Rural 1.0 9.0 38.7 4,186 Region Ashgabad City 0.8 5.0 31.0 928 Akhal 1.0 6.4 37.4 1,130 Balkan 1.8 12.8 44.9 705 Dashoguz 1.8 10.5 40.1 1,606 0.9 6.4 30.6 1,601 0.6 9.5 43.4 1,774 Education Primary/secondary 1.1 8.7 38.3 5,678 Secondary-special 1.0 7.8 37.2 1,502 0.5 6.3 34.3 534 Ethnicity Turkmen 1.1 8.6 37.8 6,051 1.2 9.0 38.2 846 1.0 5.9 37.2 817 Total 8.4 37.8 7,714 _____ ________________ _ Hemoglobin level less than 7g/dl 2 Hemoglobin level 7-9.9 g/dl 3 obin level 10-11.9 g/dl (10-10.9 g/dl for pregnant women) P REVALENCE OF A NEMIA AMONG W OMEN A GE Table 12.1 shows anemia levels among the women 15 -49 interviewed in the TDHS 2000. Almost every second woman had some degree of anemia. The level of anemia was severe in about 1 percent of the women, while 8 percent had a moderate level and 38 percent had mild anemia. Age was associated with anemia levels, with older women being somewhat more likely to be moderately or severely anemic than younger women. The rate of moderate-t o-severe a nemia (moderate and severe anemia combined) among women age h as among women age 15-19. Anemia * 143 Table 12.2 Anemia among women by nutritional status, reproductive history, and IUD use of women age 15-49 years classified as having anemia by nutritional status, reproductive history, and IUD use, Turkmenistan 2000 _______________________________________________________________ Iron-deficiency anemia _________________________________________ Severe Moderate Mild Number Characteristic anemia 1 anemia 2 anemia 3 measured _______________________________________________________________ Nutritional status BMI � BMI 18.5 Reproductive history No pregnancies Number of births Number of births � 2 Average birth interval hs Average birth interval � 24 months Currently using Currently not using Total 1.3 9.8 39.2 732 1.0 8.3 37.8 6,954 0.5 4.9 34.0 2,765 0.5 5.9 35.6 3,658 1.6 10.6 40.0 4,036 1.9 10.4 39.1 1,516 1.5 12.0 41.5 1,340 1.7 9.8 44.0 1,923 0.9 7.9 35.9 5,771 1.1 8.4

37.9 7,694 _ ____ _ 1 Hemoglobin level less than 7g/dl 2 Hemoglobin level 7-9.9 g/dl 3 Hemoglobin level 10-11.9 g/dl (10-10.9 g/dl for pregnant women) High rates of moderate and severe anemia were found among women living in the Balkan nd Dasho 15 percent and 12 percent, respectively), while only 6 percent of women in Ashgabad City were diagnosed as having moderate or severe anemia. Women with a higher education are less frequently anemic than women with a primary or secondary-special education. The rates of moderate and severe anemia are highe ethnic Tu rkmen and Uzbek women (10 percent each) than among women of other eth nic group s (7 percent). There are differentials in the anemia rates by nutritional and reproductive health characteristics. Table 12.2 shows that the prevalence of moderate-to-severe anemia is higher among women with a body mass index (BMI) less than 18.5 (11 percent) than among women with a higher BMI (9 percent). The prevalence of moderate-to-severe anemia among women with two or mo r births (12 perce nt) is twice as high as that among women with fewer than two births or no pregnancies (6 and 5 percent, respectively). There is a relatively small association between the birth intervals and the rate of anemia. Studies also suggest that IUD use ca d to iron depletion and iron-deficiency anemia. Table 12.2 also shows that among women who are using int ra uterine devices as a method of contraception, the preva lence of moderate-to-severe anemia (12 percent) is higher than among women who are not using the IUD (9 percent). According to the TDHS 2000 ata, 25 percent of women age 15-49 in Turkmenistan were using an IUD ime of the survey, i.e., when they were tested for anemia. 144 * Anemia Table 12.3 Iron supplementation of women who were g tablets during current or last pregnancy and average number of days women took iron tablets duri ng t background characteristics, Turkmenistan 2000 _ _____________________________________________ _ Iron supplementation for current pregnancy or last birth ______________________________ Percentage Weighted who Average number Background number of characteristic pills of days women _______________________________________________ _ ___ _ Age 15-19 (32.9) (8.1) 42 20-24 33.9 13.6 579 25-29 30.7 15.2 831 30-34 33.1 13.1 581 35-39 33.5 14.0 304 40-44 29.9 15.1 107 46-49 (30.0) (10.0) 26 Residence Urban 31.5 15.4 1,052 Rural 33.0 12.9 1,417 Region Ashgabad City 36.2 18.5 266 Akhal 10.3 18.8 352 Balkan 17.4 10.6 215 Dashoguz 69.6 15.1 520 Lebap 29.7 11.9 513 18.9 11.1 603 Education Primary/secondary 31.4 14.1 1,715 Secondary-special 34.3 13.0 560 35.1 15.6 194 Ethnicity Turkmen 29.3

13.8 1,992 53.4 14.5 295 31.5 14.7 182 Total 32.3 14.0 2,470 _ _ _________________________________________________ _ res in parentheses are based on 25-49 unweighted cases. 12.3 I RON S UPPLEMENTATION DURING P REGNANCY Supplementation of iron during pregnancy is one of the main components o f the Anemia Control and Preven tio n Str ateg y of the UNICEF Area Office for Central Asian Republics. The government of Turkmenistan su pp orts this program by promoting iron supplementation dur- ing pregnan nd the postpartum pe- riod. The recommended dosage of iron supplementation fo r pregnant women is currently 60 mg per day for six months. This dosage may be increased to 120 mg if the duration of su short. In addition to the iron supplemen- ta tio supplementation of 400 mg of folic acid around the time of conception not only prevents megaloblastic an emi a but also significantly reduces the inci - dence of neural tube defects, which are severe birth defects ( Sto ltzfus and Dreyfuss, 1998). In the TDHS 2000 women were asked whether t hey received iron pills during their last pregnancy. As shown in Table 12.3, 32 perc en t of women in Turkmenistan received iron pills during their last pregnancy. On average, women took iron pills for 14 days. Iron suppl em entation is most common in Dashoguz region in terms of the percent- age o f women taking iron pills: 70 per- cent. The Akhal re gion has the lowest percentage of women who took iron pills during their last pregnancy (10 percent). the average gth of the iron supplementation among the women in Akhal region (19 days) was greater than in any other survey region of Turkmenistan. Iron supplementation is more common a mong Uzbe k women (53 percent) than among Turkmen women or women of oth er ethnicities (29 and 32 percent, respectively). There was no significant difference in the percentage of women who received iron supplements by their age, type of residence, and level of education. Anemia * 145 .4 Anemia among children of children under five years of age classified as having anemia, by background characteristics, Turkmenistan 2000 ____________________________ _________ __________________________ Iron-deficiency anemia __________________________________________ Severe Moderate Mild Number characteristic anemia 1 anemia 2 anemia 3 measured ____ _________ __________________________________________________ Residence Urban 0.3 18.0 22.6 1,115 Rural 0.8 14.6 17.2 1,835 Region Ashgabad City 0.0 19.3 20.8 228 Akhal 0.0 10.1 20.4 444 Balkan 1.2 23.2 25.8 258 Dashoguz 1.3 23.9 27.0 574 Lebap 0.9 19.3 21.6 683 0.0 6.7 8.1 763 Education Primary/secondary 0.6 15.1 18.8 2,076 Secondary-special 0.7 16.3 21.8 667 0.1 22.5 16.0 207

Ethnicity Turkmen 0.5 15.3 18.4 2,444 1.4 18.9 25.3 340 0.3 18.8 19.8 166 Total 0.6 15.9 19.3 2,950 _______________________________ _____________________ _ 1 Hemoglobin level less than 7g/dl 2 Hemoglobin level 7-9.9 g/dl 3 Hemoglobin level 10-10.9 g/dl Thus, despite efforts promoti ng iron supplementation, more than half of the women in Turkmenistan did not receive iron supplements during their l who received iron pills took them for a shorter period than recommended. 12.4 A NEMIA P REVALENCE AMONG C HILDREN 12.4 presents anemia rates for children in Turkmenistan by background characteris- tics. Thi rty -six percent of the children under the age of five suffer from some degree of anemia; 16 percent have moderate anemia, and 1 percent are severely anemic. As was the case with women, there are substantial differences in the anemia rates among children by residence, region, level of mother’s education, and ethnicity. The p revalence of moderate-to-severe anemia among children living in urban areas is higher than among children living in rural areas (18 and 15 percent, respectively). As with the women, the rate of moderate-to- anemia is highest among children living in Balkan and Dashoguz regions (24 and 25 percent, respectively). Prevalence of moderate-to-severe anemia is relatively low among children living in Mary and Akhal regions: 7 and 10 percent, respectively. As in Ashgabad City, in Mary and Akhal egions, no cases of severe anemia were diagnosed among children. Intermediate level f moderate-to-severe anemia were found among children in Ashgabad City and Lebap Region: 19 and 20 percent, respectively. 146 * Anemia Table 12.5 Anemia among children by demographic characteristics and nutritional status Percentage of children under five years of age classified as having anemia by demographic characteristics, Turkmenistan 2000 ______________________________________________________________ Iron-deficiency anemia ________________________________________ Demographic Severe Moderate Mild Number characteristic anemia 1 anemia 2 anemia 3 measured ______________________________________________________________ Sex of child Male 0.8 17.4 18.2 Female 0.3 14.3 20.4 1,458 Age of child 0-24 months 0.5 18.0 19.3 601 nths 0.6 15.4 19.2 2,349 Birth order 1 0.7 15.4 17.7 985 0.4 16.8 19.2 1,366 0.9 15.0 22.8 426 6+ 0.4 13.6 19.7 174 al First birth 0.7 15.4 17.8 990 hs 0.7 16.6 19.7 706 nths 0.5 16.0 20.1 869 s 0.2 15.7 20.4 384 Weight at birth 2.5 21.2 20.5 138 � 2.5 kg 0.5 15.6 19.2 2,812 Height for age Below -2 SD 1.1 21.6 19.5 660 -2 SD or above 0.4 14.2 19.2 2,290 or height Below -2 SD 0.7 18.6 15.4 173 -2 SD or above 0.6 15.7 19.5 2,777 Weight for age Below -2 SD

1.2 24.5 22.7 348 -2 SD or above 0.5 14.7 18.8 2,602 Total 0.6 15.9 19.3 2,950 ______________________________________________________________ 1 Hemoglobin level less than 7g/dl 2 Hemoglobin level 7-9.9 g/dl 3 Hemoglobin level 10-10.9 g/dl 4 ildren who are below -3 SD Table 12.4 also shows that children of mothers who have a primary or secondary education l ess like e anemia than children whose mother has a higher education. The rate of moderate-to-severe anemia among Turkmen children (16 percent) is relatively lower than among children of Uzbek and other ethnicities (20 and 19 percent, respectively). Tabl 12.5 presents anemia rates for children in Turkmenistan by demographic and nutritional characteristics. The results sho w that mo -to-severe anemia is more common Anemia * 147 among male children than amon g female c and 15 percent, respectively) and among younger children up to 24 months of age (19 percent) than among children age 24 months and older (16 percent). No significant differences in the children’s anemia rates were observed by birth order or birth interval. Looking at children’s weight at birth (a ccording to their mother’s recollection), the rate of moderate-to-severe anemia was higher among children with a weight at birth less than 2.5 kg (24 percent) tha with a birth weight of more than 2.5 kg Considering differentials by child’s nutritional status, the greatest variation in moderate-to- anemia is observed for height-for-age (stunting) and weight-for-age. The rate of moderate-to - anemia among children with height-for-age below -2 SD was 23 percent, compared with 15 percent among children with height-for-age -2 SD or above. The moderate-to-severe anemia rate among children with weight-for-age below -2 SD was 26 percent, compared with 15 percent among the children with weight-for-age -2 SD or above. 1 A microcuvette is a small, transparent laboratory vessel. Anemia * 141 ANEMIA 12 G.K. Kariyeva, A. Magtymova, and A. Sharman 12.1 I NTRODUCTION is a condition characterized by a decrease in the concentration of hemoglobin in the blood. Hemoglobin is necessary for transp orting oxy gen to tissues and organs in the body. The reduction in oxygen available to organs and tissues when hemoglobin levels are low is responsible for many of the sym ptoms experienced by anemic people. The consequences of anemia include general body weakness, freque nt tiredness sistance to disease. Anemia can be a particularly serious problem for pregnant women, leading to premature delivery weight. It is of concern in childr e e anemia is associated with impaired mental and physical development. Overall, morbidity and mortality risks increase for individuals suffering from anemia (Sharmanov, 1998). Hemoglobin testi

ng is the primary method of anemia diagnosis. The TDHS 2000 included direct measurement of hemoglobin levels in all women 15-49 and their children age 5 and under (born since January 1995). The HemoCue system was us ed in the TDHS 2000 for hemoglobin testing. This system consists of a battery-operated photom ete r and a disposable microcuvette, 1 coated with a dried reagent that serves as the blood-collection device. After obtaining consent from respondent (in the case of children, the consent of the ch ild’s mo ther), a drop of capillary blood taken fro el was drawn into a microcuvette. The blood in the microcuvette was analyzed using the photometer, which displayed the hemoglobin concentration (Sharmanov, 2000). Med cally trained personnel, primarily doctors, assigned to each of the TDHS teams conduc ted the t esting. The personnel responsible for the testing received extensive classroom training and field practice prior to the survey. During the fieldwork, e po ndent was given the results of the test immediately. In cases in which the hemoglobin reading was below 7.0 g/dl (grams per decili ter), t he respondent was referred to the local health care facilities for followup. With the permission of the respondent, the Ministry of Health and Medical Industry of Turkmenistan was also advised of the names of the individuals with a reading below 7.0 g/dl to help ensure that they would receive followup. Anemia is classified as mild, moderate, or severe based on the concentrations of hemoglobin in the blood. Mild a nemia cor responds to a level of hemoglobin concentration of 10.0-10.9 g/dl for pregnant women and children under age 5 and 10.0-11.9 g/dl for nonpregnant women. For all of the tested groups, moderate anemia corresponds to a level of 7.0-9.9 g/dl, while severe anemia corresponds to a level less than 7.0 g/dl. Turkmenistan is in the 15-64 age group, and the population age 65 years and older accounts for 5 percent of the total population. A distinct feature of the age distribution of the population is that the proportion of the dependent population—those younger than 15 or older than 65—is higher in rural areas (43 percent) than in u rban areas (39 percent). This difference may be attributed to rural-urban migra e economically active population—those age 15 to 65—especially youth, in search of jobs. Turkmenistan is in the 15-64 age group, and the population age 65 years and older accounts for 5 percent of the total population. A distinct feature of the age distribution of the population is that the proportion of the dependent population—those younger than 15 or older than 65—is higher in rural areas (43 percent) than in u rban areas (39 percent). This difference may be attributed to rural-urban migra e economically active population—those age 15 to 65—especia

lly youth, in search of jobs. 10-14, there is a gradual decrease in the proportion of the population in each success ive ag e group. The relatively small size of the male and female populations in age group 55-59 is a reflection of the low birth rates during World War II (i.e., 55 to 60 years prior to the TDHS 2000). Women 15-49 years of a ge, who are t respondents, constitute about one-half of the de facto household population: 51 percent. The results further indicate that 59 percent of the population of age 15 and as low as males per 100 females among those, age 65 and older. The ratio is almost similar in urban and rural areas (94 and 95 males per 100 women, respectively) More than one-third (36 percent) of the population consists of children 14 years of age and under, with the proportion of children in rural areas greater than in urban areas (38 and 34 percent, respectively). Starting with age g roup residence and sex. The total de facto population in the selected households was 30,830 people. In general, the survey results show that outnumber males in Turkmenistan ( 52 and 48 per cent, respectively). The male/female ratio varies by age. It is as high as 108 males per 100 females amon hou sehold and visitors who had spent the previous night in the household. A household, as defined in the survey, to a person or group of p eople usually ating together and jointly running the household’s economy (de jure population). A visitor is someone who is not a usual resident of the household but slept in the household the night before the interview. The distribution of the TDHS 2000 household population is presented in Table 2.1 and Figure 2.1, by five rt describes the housing environment in which the respondents and their children live. The background characteristics of women age 15 to 49 years are discussed in the last part of the chapter. 2.1 D EMOGRAPHIC C HARACTERISTICS OF H OUSEHOLDS Household Questionnaire was used in the TDHS 2000 to collec e demographic and social characteristics of all the usual residents of the sampled Demographic and Health Survey (TDHS). This information is useful for interpreting the survey findings and serves as an approximate indicator of the representativeness of the survey and of the quality of the data. This chapter is divided into three parts. The first part deals with the characteristics of the household population in terms of age-sex composition, ho us ehold size and distribution, and educational background. The sec Household Population and Housing Characteristics * 9 2 HOUSEHOLD POPULATION AND HOUSING CHARACTERISTICS B.S. Sopyev and K. Fair This chapter provides a descriptive summary of the demographic and so ci oeconomic characteristics of the househo ld pop ulation and the individual respondents in the 2000 Tur