/
An integrated biogeochemistry sampling plan across systems An integrated biogeochemistry sampling plan across systems

An integrated biogeochemistry sampling plan across systems - PowerPoint Presentation

faustina-dinatale
faustina-dinatale . @faustina-dinatale
Follow
379 views
Uploaded On 2017-05-21

An integrated biogeochemistry sampling plan across systems - PPT Presentation

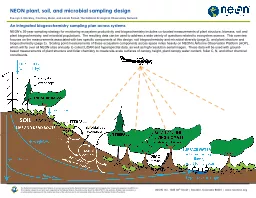
NEONs 30year sampling strategy for monitoring ecosystem productivity and biogeochemistry includes colocated measurements of plant structure biomass soil and plant biogeochemistry and microbial populations The resulting data can be used to address a wide variety of questions related to eco ID: 550861

soil plots measurements biogeochemistry plots soil biogeochemistry measurements sampling plant microbial ytotal design tower chemistry data gradient neon distributed

Share:

Link:

Embed:

Download Presentation from below link

Download Presentation The PPT/PDF document "An integrated biogeochemistry sampling p..." is the property of its rightful owner. Permission is granted to download and print the materials on this web site for personal, non-commercial use only, and to display it on your personal computer provided you do not modify the materials and that you retain all copyright notices contained in the materials. By downloading content from our website, you accept the terms of this agreement.


Presentation Transcript

Slide1

An integrated biogeochemistry sampling plan across systemsNEON’s 30-year sampling strategy for monitoring ecosystem productivity and biogeochemistry includes co-located measurements of plant structure, biomass, soil and plant biogeochemistry, and microbial populations. The resulting data can be used to address a wide variety of questions related to ecosystem science. This overview focuses on the measurements associated with two specific components of this design: soil biogeochemistry and microbial diversity (page 2), and plant structure and biogeochemistry (page 3). Scaling point measurements of these ecosystem components across space relies heavily on NEON’s Airborne Observation Platform (AOP), which will fly over all NEON sites annually to collect LiDAR and hyperspectral data, as well as high-resolution aerial images. These data will be used with ground-based measurements of plant structure and foliar chemistry to create site-scale surfaces of canopy height, plant canopy water content, foliar C, N, and other chemical constituents.

NEON plant, soil, and microbial sampling design

Eve-Lyn S. Hinckley, Courtney Meier, and Jacob Parnell, The National Ecological Observatory NetworkSlide2

NEON soil biogeochemistry and microbial diversity designMicroorganisms are critical drivers of biogeochemical processes that influence global climate, water quality, and atmospheric composition (Vitousek et al., 1997). Consequently, measuring soil microbes and soil biogeochemistry is central to NEON’s success.

40m

In

order to adequately measure microbial diversity, function, and soil biogeochemistry, soil samples will be collected from up to 20 tower and

d

istributed

p

lots (above;

see spatial design handout). Soil sampling plots are co-located with plant diversity measurements (green areas) and tissue chemistry to maximize associated measurements.

One soil core

will be collected in

three of the four subplots

per plot for a total of three soil cores per plot per sampling event.

Measurement

Frequency

Output

16S rRNA sequencing

1

-3x

per y

Richness, evenness, OTU tables

ITS rRNA sequencing

1

-3x

per y

Richness, evenness

Shotgun metagenomicsAnnuallyPotential functional diversityShotgun metatranscriptomicsAnnuallyActive functional diversity16S rRNA qPCR1-3x per yBacterial/archaeal abundancesITS rRNA qPCR1-3x per yFungal abundancesMicrobial biomassEvery 3-5 ySoil microbial biomass

MeasurementFrequencyTextureOnceBulk densityOnceOrganic horizonOnceTotal CEvery 10 yTotal NEvery 10 yTotal PEvery 10 yTotal SEvery 10 yOrganic CEvery 10 yCations and anionsEvery 10 ypH3x per yC and N stable isotopesEvery 10 yInorganic N3x every 5 yP fractionsEvery 10 yNet nitrification3x every 5 yNet N mineralization 3x every 5 yOrganic C fractionsEvery 10 yTemperatureEvery soil sampling eventMoistureEvery soil sampling event

Microbial Measurements

Biogeochemical Measurements

All NEON data will be made publicly available via a web portal following initial QA/QC

Vitousek, P.M., H.A. Mooney, J. Lubchenco, and J.M. Melillo. 1997. Human domination of Earth’s ecosystems. Science 277(5325): 494-499.

Organic soils are collected as square “brownies”

Mineral soils are collected with a coring device

20x20m subplotSlide3

NEON plant biomass, productivity, and biogeochemistry designMeasurement

Frequency

Total C*

Every 5 y

Total

N*

Every

5 y

Total S

Every

5 y

Total P

Every

5 y

δ13C*

Every

5 y

δ15N*

Every

5 y

Chlorophyll

Every

5 y

Lignin

Every

5 y

CationsEvery 5 yChemical measurements of sun-lit foliage (*applies to litter and roots)Key foci of the sampling design supported by plot-based field measurements (black text), and by instrumentation (red text).Biomass, productivity, and biogeochemistry data originate from Distributed, Gradient, and Tower PlotsVegetation componentSampling frequencySpatial extentVegetation structure, woody stemsAnnual (Tower plots)Every 3 y (Distributed/ Gradient plots)Tower plotsDistributed plots (max n=20)Gradient plots (if necessary)Herbaceous plants1X-2X per yearTower plotsDistributed plots (max n=20)Chemistry every 5 yMat-forming bryophytesAnnualTower plotsLitter, fine woody debrisEvery 8 wks; every 2 wk for deciduous in autumnTower plots; chemistry every 5 yCoarse woody debrisEvery 5 yTower plotsDistributed Plots (max n=20)Belowground biomassAnnualTower plots; chemistry every 5 yLeaf area index2 weeks (Tower Plots)Every 5 y (Distributed/Gradient Plots)Tower plots (n=3)Distributed plots (max n=20)Gradient plots (if necessary)