/
Design of Cooperative Vehicle Safety Systems Based on Design of Cooperative Vehicle Safety Systems Based on

Design of Cooperative Vehicle Safety Systems Based on - PowerPoint Presentation

faustina-dinatale
faustina-dinatale . @faustina-dinatale
Follow
424 views
Uploaded On 2016-07-28

Design of Cooperative Vehicle Safety Systems Based on - PPT Presentation

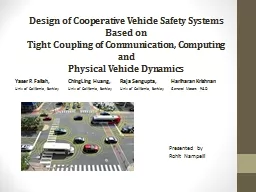
Tight Coupling of Communication Computing and Physical Vehicle Dynamics Yaser P Fallah ChingLing Huang Raja Sengupta Hariharan Krishnan Univ of California Berkley ID: 423147

communication rate cvs transmission rate communication transmission cvs physical error range vehicle component tracking safety computing tightly systems process

Share:

Link:

Embed:

Download Presentation from below link

Download Presentation The PPT/PDF document "Design of Cooperative Vehicle Safety Sys..." is the property of its rightful owner. Permission is granted to download and print the materials on this web site for personal, non-commercial use only, and to display it on your personal computer provided you do not modify the materials and that you retain all copyright notices contained in the materials. By downloading content from our website, you accept the terms of this agreement.


Presentation Transcript

Slide1

Design of Cooperative Vehicle Safety Systems Based onTight Coupling of Communication, Computing andPhysical Vehicle Dynamics

Yaser P. Fallah, ChingLing Huang, Raja Sengupta, Hariharan KrishnanUniv of California, Berkley Univ of California, Berkley Univ of California, Berkley General Motors R&D

Presented byRohit NampelliSlide2

IndexAbstractIntroductionExisting Knowledge on CVSDSRC Bases CVS System (Existing architecture)Tightly Coupled CVS System (Proposed System)Component Modeling: Computation on Communication

Component Modeling: Physical process EstimationCPS Component Interaction: Tightly Coupled Design.Experimental EvaluationConclusionsSlide3

AbstractCPS: Computing, Communication, Physical Dynamics.CVS: Vehicles broadcast their physical state information, so their neighbors can track and predict possible collisions.Physical Dynamics of vehicles -> Required accuracy for tracking -> Load on the network -> Network performance.

The tight mutual dependence of these factors require the system to be tightly coupled.We design a tightly coupled system and compare it with systems with independently developed subcomponents.Slide4

IntroductionA Cooperative Vehicle Safety (CVS) systems deliver warning messages to driver / directly take control of the vehicle.Cyber component: Detection of threats ,Transmit safety messages.

Existing models don’t consider the relation between network load, tracking process, effect of physical dynamics, estimation accuracy.By coupling the design of the cyber component with the components related to vehicle dynamics we can gain significant performance improvement.Slide5

Existing knowledge on CVSLatency of warningsActive safety systems (Collision Avoidance – low latency)Situational awareness (Heads up info of non immediate dangers)Active safety systems – Dedicated Short Range Communication (DSRC) channels. Low Latencies of few hundred

ms.Fig 1: V2V CVS Communication using DSRCSlide6

Existing knowledge on CVSSituational awareness : 30 – 60 Secs ahead of the vehicle.Due to high latencies of present communication technologies, they can only function for situational awareness but not for Active safety systems.

Ex: warning about a traffic queue at a road curve.Fig 2: Network Traveler Soft Safety warning systemSlide7

DSRC based Cooperative Vehicle Safety SystemsDSRC based CVS has 2 types of safety messagesEvent driven emergency messages (High Priority)Frequent vehicle tracking messages (Low priority)

Vehicle Tracking Messages : Include vehicle location, speed. Used to track neighboring cars. (Tracking has to be accurate)In high traffic, DSRC channel is easily saturated. Slide8

Tightly Coupled CVS SystemSlide9

Tightly Coupled CVS SystemEstimate the physical process (location, speed) in computing module.Traditional systems samples this state and broadcasts at 100msec intervals.Instead, use a model based estimator Constant speed model: Vehicle speed remains constant between sampling times.

Each CVS device has a bank of estimators for the vehicles it is tracking.Sender runs a local estimator of its own position using the same model that is used at remote estimators.If the estimate is found to have large error when compared with its actual position, transmission logic broadcasts a new message to the other cars.Slide10

CPS Component Modeling: Effect of Computation/ Physical Processes on Communication

Understand the relation between the Computation/physical process and communication module.Transmission control logic (Fig 4) controls parameters in communication module allowing optimal performance.Communication process parameters: Packet frequency, length, power, MAC layer settings.Few of them being predetermined, Packet Rate, Power Level are only controllable.Performance Metric: Information Dissemination Rate (IDR) / Broadcast Throughput -> No of sender packets received at the receivers. Simulation of the VANET and observed IDR for various Transmission Rates (R), Ranges (D). Slide11

Effect of Computation/ Physical Processes on CommunicationFigure 5 Information Dissemination Rate vs. range of transmission for differenttransmission rates,

ρ=.1

Figure 6 5 Information Dissemination Rate

vs. range of transmission for different

transmission rates,

ρ=.2

For a given values of rate R and traffic density

ρ

, there exists a value of D which

Yields maximum IDR.

For a selected R, an optimal operation can be reached by varying the D value.Slide12

Effect of Computation/ Physical Processes on CommunicationFigure 7 The effect of transmission range (D) and rate (R) choices on channel occupancy (U)

Figure 8 IDR vs. channel occupancy for different values

of R(5-115

msg

/sec), D(20-400m), and ρ (0.1-0.2

vehicle/m)Relationship

Channel Occupancy (U) can be used as network feedback which is used for

controlling the communication component.

In the relation between IDR and U, For different values of R, D,

ρ

it can be

observed that all the IDR values fall on a single curve which means that IDR and

U are related.

It means that a controller must be designed to run at an optimal channe

l

occupancy

Where IDR is maximum. (in this case, channel occupancy is 0.6)Slide13

CPS Component Modeling: Computing module and physical process estimationAccuracy levels depend on the rate of message transmission. Faster moving cars need to transmit messages at a higher rate.Effect of Physical process / communication performance (message rate) on computing performance (tracking accuracy).

Message rate : Rate of successful reception of messages (transmission rate x success probability).Packet transmission is varied by eitherProbabilistic policyError dependent policyMessage Accuracy is defined in 2 waysMSE: Mean Square Error95% cut-off errorSlide14

Computing module and physical process estimation

95% cut-off error is the value below which 95% of the error histogram lies.Rate of transmission in probabilistic policy is controlled by changing the probability of transmission.Rate of transmission for Error dependent policy is controlled by adjusting an error sensitivity parameter α.The error rate drops quicker in case of error dependent policy. The error saturates at a point. At that point, the network must be used to reach the farther nodes.Slide15

CPS Component Interaction and Tightly Coupled DesignCommunication subcomponent can control the Range of transmission by setting the power level and provides feedback on the measured channel occupancy.

The objective here is to design algorithms that control the rate, R, and range, D, of transmission based on the observed network feedback U, and perceived tracking error e.Tracking accuracy (data delivered to the receivers) is related to rate of transmission (R). R can be controlled by varying the Range of transmission (D). So for crowded networks, we reduce the range in increase the accuracy. Vice versa, for sparse networks we increase the range. Slide16

CPS Component Interaction and Tightly Coupled DesignRange control algorithmController must maintain U between Umin = 0.4 and

Umax = 0.8.Slide17

Evaluation

CaseDirection 1 StatusDirection 1 SpeedDirection 2 StatusDirection 2 SpeedH1Congested14mphCongested

14mphH2Low Speed30mph

Low speed

30mph

M1

Congested

14mph

Free flow

74mph

M2

Low Speed

30mph

Free flow

74mph

Figure 12 OPNET and SHIFT simulation results for different

traffic scenarios, the proposed range control scheme vs. fixed

range.Slide18

ConclusionsWe have seen the interaction and mutual effects of different components of the CVS.Tight coupling of computing, communication and physical dynamics of the CVS have been observed.We have observed that the tight coupling of the CPS components increases the performance of the CVS.With availability of micro level models of communication and computing, the proposed method can still be improved. Slide19

Queries ?