/
Early Nutritional Support Influences Body Composition Early Nutritional Support Influences Body Composition

Early Nutritional Support Influences Body Composition - PowerPoint Presentation

faustina-dinatale
faustina-dinatale . @faustina-dinatale
Follow
347 views
Uploaded On 2018-12-15

Early Nutritional Support Influences Body Composition - PPT Presentation

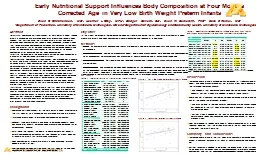
at Four Months Corrected Age in Very Low Birth Weight Preterm Infants Ellen C Christiansen MD 1 Heather L Gray MPH 1 Bridget Davern BA 1 Ellen W Demerath PhD ID: 741627

body fat mass weight fat body weight mass composition increased intake age life protein length week birth corrected months

Share:

Link:

Embed:

Download Presentation from below link

Download Presentation The PPT/PDF document "Early Nutritional Support Influences Bod..." is the property of its rightful owner. Permission is granted to download and print the materials on this web site for personal, non-commercial use only, and to display it on your personal computer provided you do not modify the materials and that you retain all copyright notices contained in the materials. By downloading content from our website, you accept the terms of this agreement.


Presentation Transcript

Slide1

Early Nutritional Support Influences Body Composition at Four Months Corrected Age in Very Low Birth Weight Preterm InfantsEllen C Christiansen, MD1, Heather L Gray, MPH1, Bridget Davern, BA1, Ellen W Demerath, PhD2, Sara E Ramel, MD11Department of Pediatrics, University of Minnesota, Minneapolis, MN and 2Department of Epidemiology and Community Health, University of Minnesota, Minneapolis, MN

Abstract

Background:

Aggressive nutritional support of very low birth weight (VLBW) infants is associated with improved long-term growth, and recent studies suggest that nutrition within the first week of life is critical. The goal of optimizing body composition has recently been recognized through studies that reveal improved neurocognitive outcomes with increased fat free mass (FFM) and greater risk for metabolic syndrome with increased adiposity. The effect of aggressive nutritional support in the first week of life on body composition after discharge has not been documented.

Objective:

To investigate the effect of early nutrition on body composition at 4 months of age corrected for prematurity (CA).

Design/Methods:

Aggressive nutritional support was provided per standard of care, and intake from day of life (DOL) 2-8 was recorded prospectively on

56 VLBW infants. Body composition was measured via air displacement plethysmography at 4 months CA. Multiple regression analysis was performed to assess the relationship between early nutrition and later body composition. Co-variates added to the models were sex, illness score on DOL 1, birthweight, gestational age at birth and corrected age at visit.Results: Greater caloric intake from DOL 2-8 was associated with increased FFM, weight, length, and OFC at 4 months CA in the adjusted model. Greater protein intake was modestly associated with only weight (p=0.06). Neonates received a mean of 93± 13.2 kcal/kg/d and 3.6± 0.4 g/kg/d of protein from DOL 2-8.Conclusions: Increased caloric intake in the first week of life significantly increased FFM with only a modest increase in fat mass at 4 months CA. Lack of association with protein intake may be due to aggressive protein supplementation and inability to accrete additional protein during periods of illness. Further research is needed to determine the optimal body composition to improve long-term outcomes such as neurodevelopment, later growth, and metabolic syndrome.BackgroundAggressive nutritional support of the very low birth weight preterm infant in the first week of life is associated with improved initial and late growth.Improved growth leads to improved neurocognitive outcomes. However, rapid early growth is also linked to increased adiposity, which may cause later obesity, increased blood pressure, and increased risk for cardiovascular disease. With these two realities, the goal is to promote growth that supports optimal neurocognitive outcomes but also reduces or at least does not attenuate an infant’s risk for metabolic syndrome. Body composition of premature infants is being examined to further delineate effects of diet. The relationship between nutrition within the first week of life and body composition at follow-up has not been investigated.

Results

Table 1. Characteristics of 56 AGA VLBW preterm infants

Discussion

Increased caloric intake is associated with increased fat free mass, length, weight, and head circumference but not fat mass at four month follow-up in the full model regression analysis. This suggests that aggressive caloric goals may be met without increased adiposity. Further studies are needed to replicate these results. There was not a significant correlation between increased protein intake and any of the above factors except for weight. This may be due to relatively uniform aggressive protein support among our neonates in the first week or perhaps due to an inability to accrete protein during illness. Further study is needed on this topic as increased protein content of normal caloric feeds post-discharge have shown decreased fat gain in previous study. Similar anthropometric findings were seen at hospital discharge as at 4 month follow-up, indicating that the effects of nutrition in the first week of life remain stable over the infant’s early life. Summary and ConclusionsIncreased caloric intake in the first week of life significantly increased FFM without a significant increase in fat mass at hospital discharge and 4 months CA. Further research is needed to determine the effects of diet in the first week of life on long-term outcomes such as neurodevelopment, later growth and body composition, and risk for metabolic syndrome.

Figure 1. Fat free mass as related to caloric intake

Table 2. Association between energy intake (kcal/kg/d) from DOL 2-8 and infant anthropometrics and body composition at hospital discharge and at four months CA


Mean (SD)Range Sex, male N (%)27 (48.20)- Days inpatient72.79 (31.91)22.0-132.0 Hyperglycemic (days)4.50 (8.25)0.0-38.0 Positive pressure (days)47.05 (43.17)0.0-131.0 Antibiotics (days) 15.68 (17.94)0.0-75.0 Steroids (days)8.59 (16.11)0.0-68.0 SNAP DOL 110.41 (7.40)0.0-32.0 SNAP DOL 73.86 (6.12)0.0-25.0 ROP ≥stage 2, yes N (%)15 (26.8)- IVH ≥stage 2, yes N (%)13 (23.2)-Birth    Gestational age (wks)27.64 (2. 46)23.0-32.0 Weight (g)1023.13 (291.56)470.0-1557.0 Weight z score-0.17 (0.70)-1.63-1.20 Length (cm)35.66 (3.76)27.50-43.50 Length z score-0.37 (0.75)-1.90-1.10 OFC (cm)25.20 (2.48)19.5-29.5 OFC z score-0.20 (0.62)-1.80-1.50Discharge †    Corrected age (wks)38.09 (2.75)34.42-46.00 Weight (g)2648.51 (602.7)1881.50-4136.80 Length (cm)45.33 (3.1)41.10-57.50 OFC (cm)33.40 (1.95)30.00-38.30 Fat free Mass (g)2129.04 (379.99)1602.00-2994.20 Fat Mass (g)511.61 (241.42)190.00-1142.70 Body Fat (%)18.56 (4.81)10.50-28.504 Month CA ††   Corrected age (wks)57.59 (1.97)54.0-63.0 Weight (g)6281.25 (928.25)4034.80-7871.10 Length (cm)60.49 (3.48)48.80-66.50 OFC (cm)41.65 (1.75)36.70-44.50 Fat Free Mass (g)4840.36 (619.73)3477.10-5968.50 Fat Mass (g)1379.15 (428.56)336.10-2439.20 Body Fat (%)21.79 (4.93)8.30-32.40SNAP=Score for neonatal acute physiology ; ROP=Retinopathy of Prematurity; IVH=Intraventricular hemorrhage. †n=50; ††n=47 

This study was funded by the Amplatz Scholar Award

† Discharge final models include infant’s corrected age in weeks; 4moCA final models include infant’s corrected age in weeks, sex, SNAP DOL1, and the residuals of birth weight regressed against gestational age.

  Unadjusted ModelFinal Model† b(SE)PR2b(SE)PR2Discharge (n=50)       Weight (g)-13.76 (6.25)0.030.098.16 (5.63)0.20.53 Length (cm)-0.05 (0.03)0.10.060.06 (0.03)0.020.55 Head Circumf (cm)-0.03 (0.02)0.10.050.04 (0.02)0.020.52 Fat Free Mass (g)-7.07 (4.01)0.080.067.79 (3.41)0.030.57 Fat Mass (g)-5.65 (2.50)0.030.100.86 (2.68)0.750.34 Body Fat (%)-0.12 (0.05)0.020.11-0.04 (0.06)0.50.214 month CA (n=47)       Weight (g)5.57 (1.21)<0.00010.3236.9 (8.96)0.00020.50 Length (cm)0.01 (0.01)0.0080.150.10 (0.03)0.0060.50 Head Circumf (cm)0.01 (0.002)<0.00010.290.07 (0.02)0.00040.42 Fat Free Mass (g)3.12 (0.86)0.00070.2321.8 (5.55)0.00030.57 Fat Mass (g)1.73 (0.62)0.0080.159.63 (5.20)0.070.21 Body Fat (%)0.01 (0.01)0.20.040.04 (0.06)0.60.10

ObjectiveIn this study, we evaluate the relationship between nutritional intake during the first week of life of very low birth weight premature infants and body composition at hospital discharge and follow-up at 4 months CAMethodsSample: 56 appropriate for gestational age (AGA) preterm infants who were born between 2011 and 2012 at the University of Minnesota Growth Parameters: Routine anthropometrics (weight, length, head circumference) were recorded and body composition via air displacement plethysmography was measured at hospital discharge and at 4 months corrected ageEarly nutritional support: Nutritional intake was recorded prospectively from days of life 2-8 as kcal/kg/day and grams of protein/kg/day. Statistical analysis: The association between body composition as the dependent variables and energy or protein intake as the independent variable were plotted to confirm a linear relationship. Identified co-variates (sex, gestational age at birth, birth weight, SNAP DOL 1 and corrected age at time of measure) were added stepwise to linear regression models and retained in final multivariate regression models where the r2 improved from the unadjusted models.

Figure 2. Length as related to caloric intake